The Monitors Page
The Monitors section in Pulsetic is your command center for managing and viewing the real-time health of your websites and APIs. It provides a clear, at-a-glance overview of uptime, performance, and potential issues.
Understanding Your Monitors Page
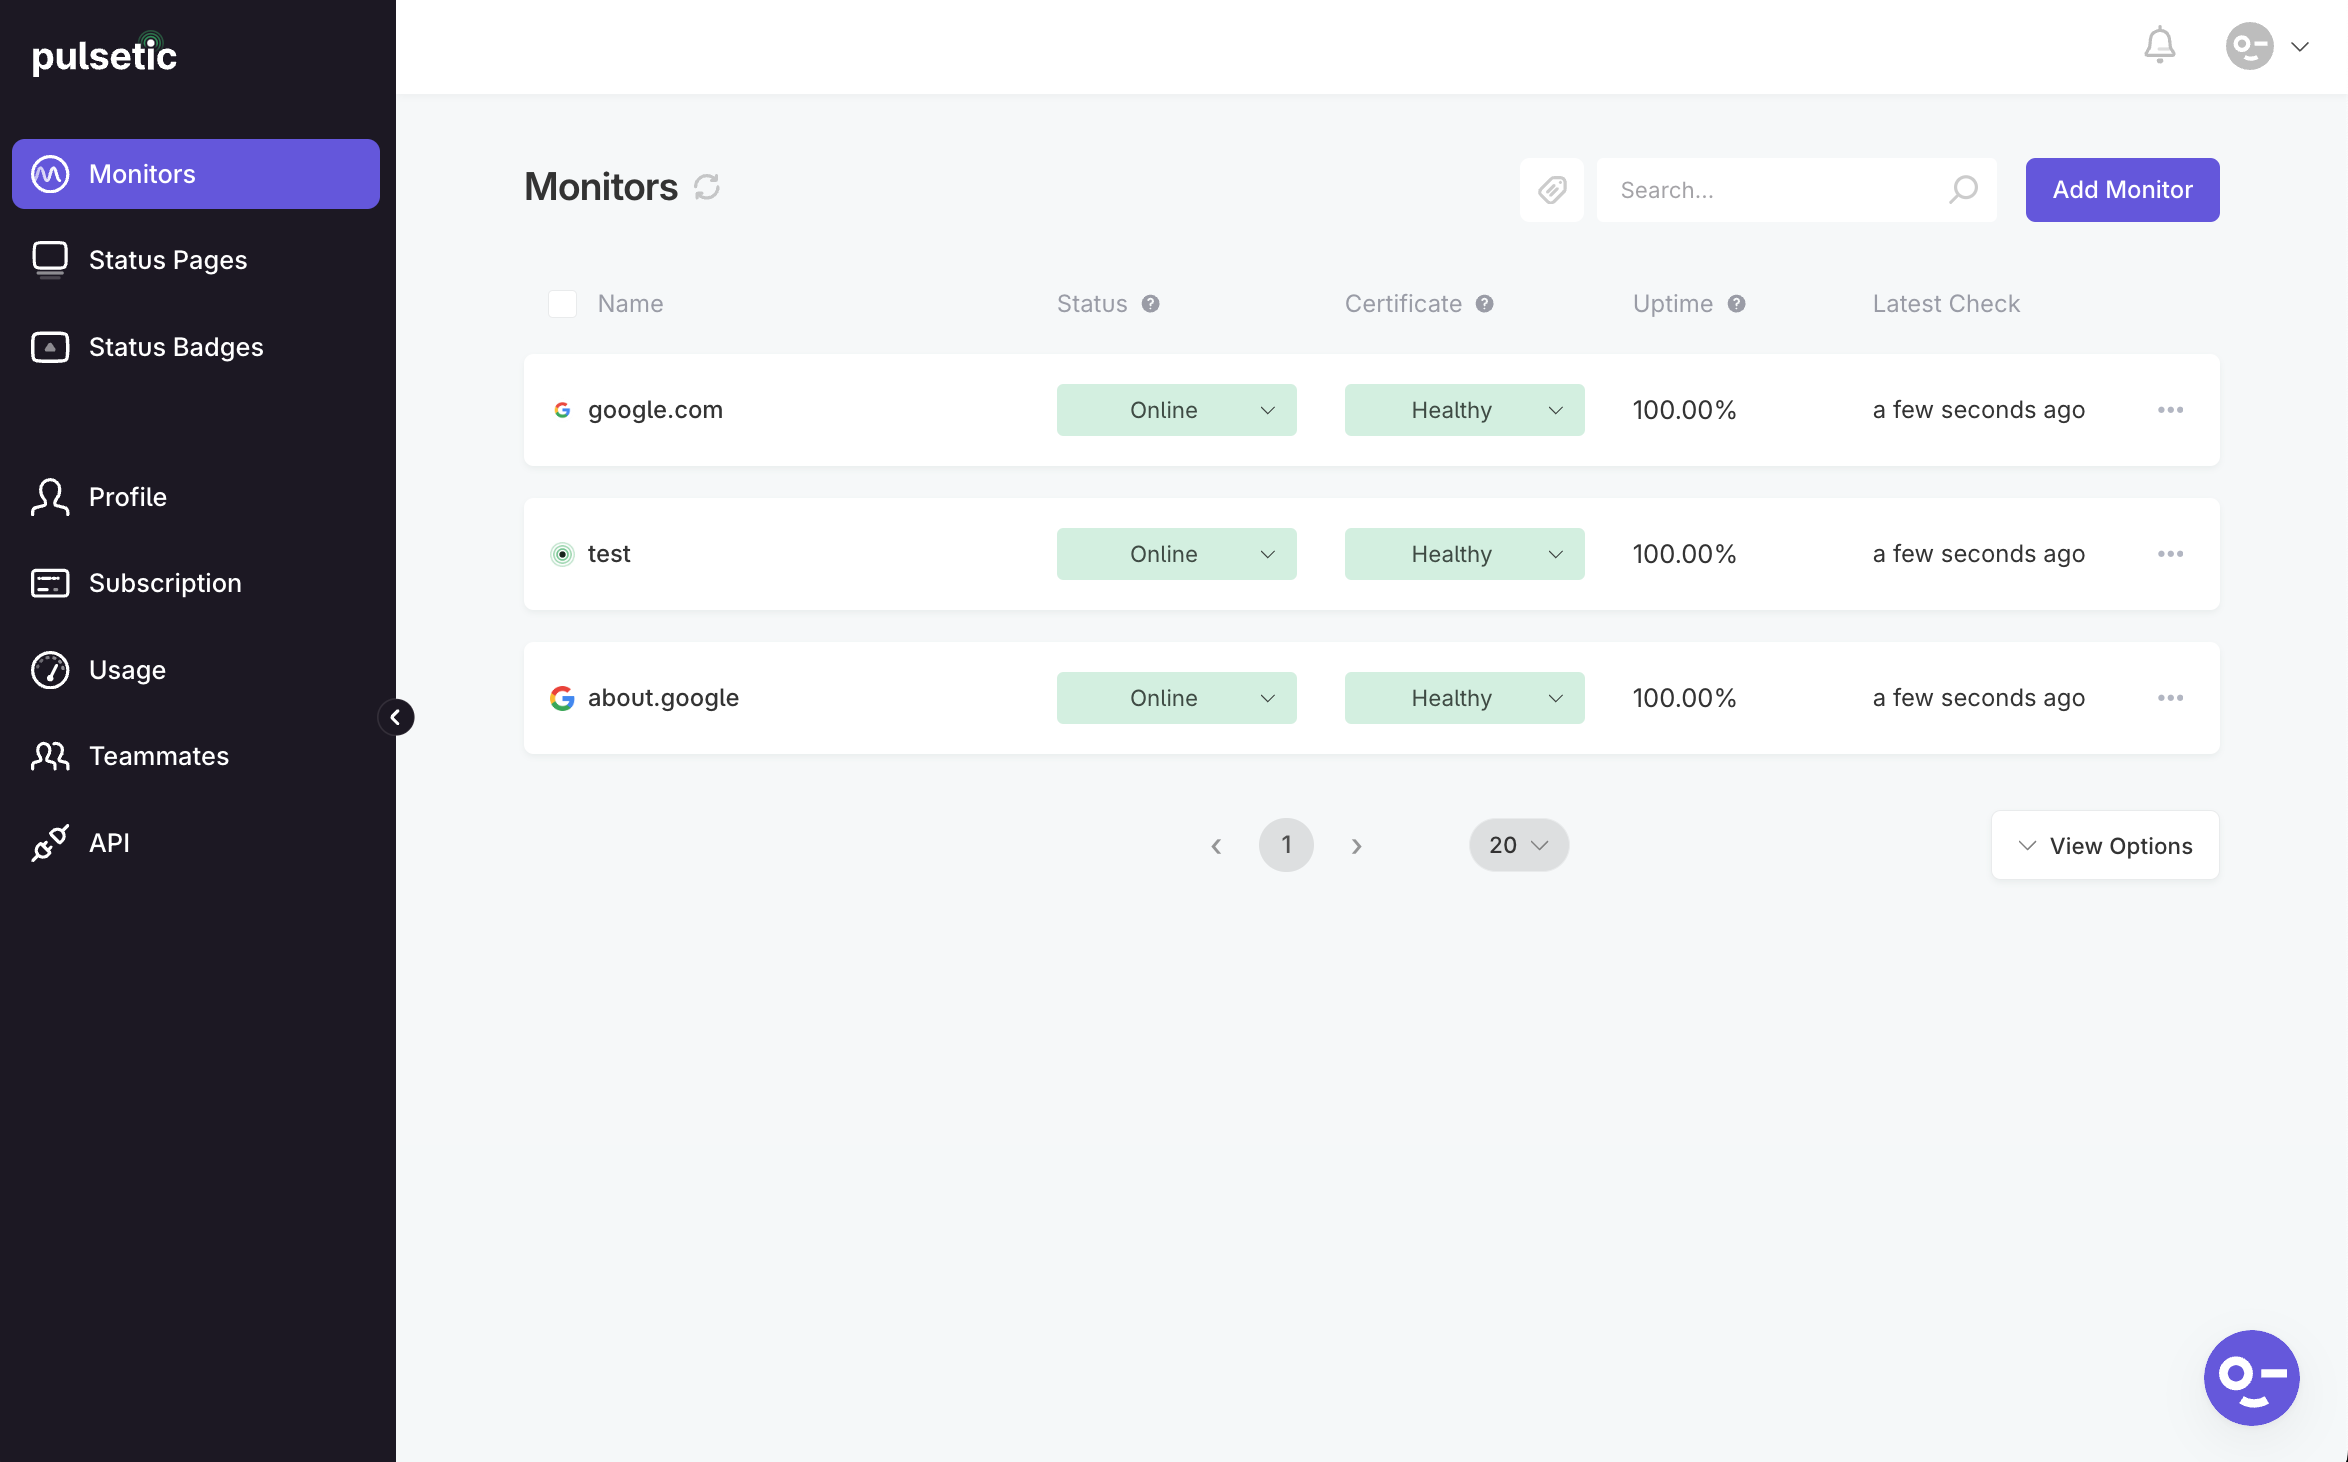
On the Monitors page, you'll get two ways to view your data:
- Dashboard: A quick overview of all your assets.
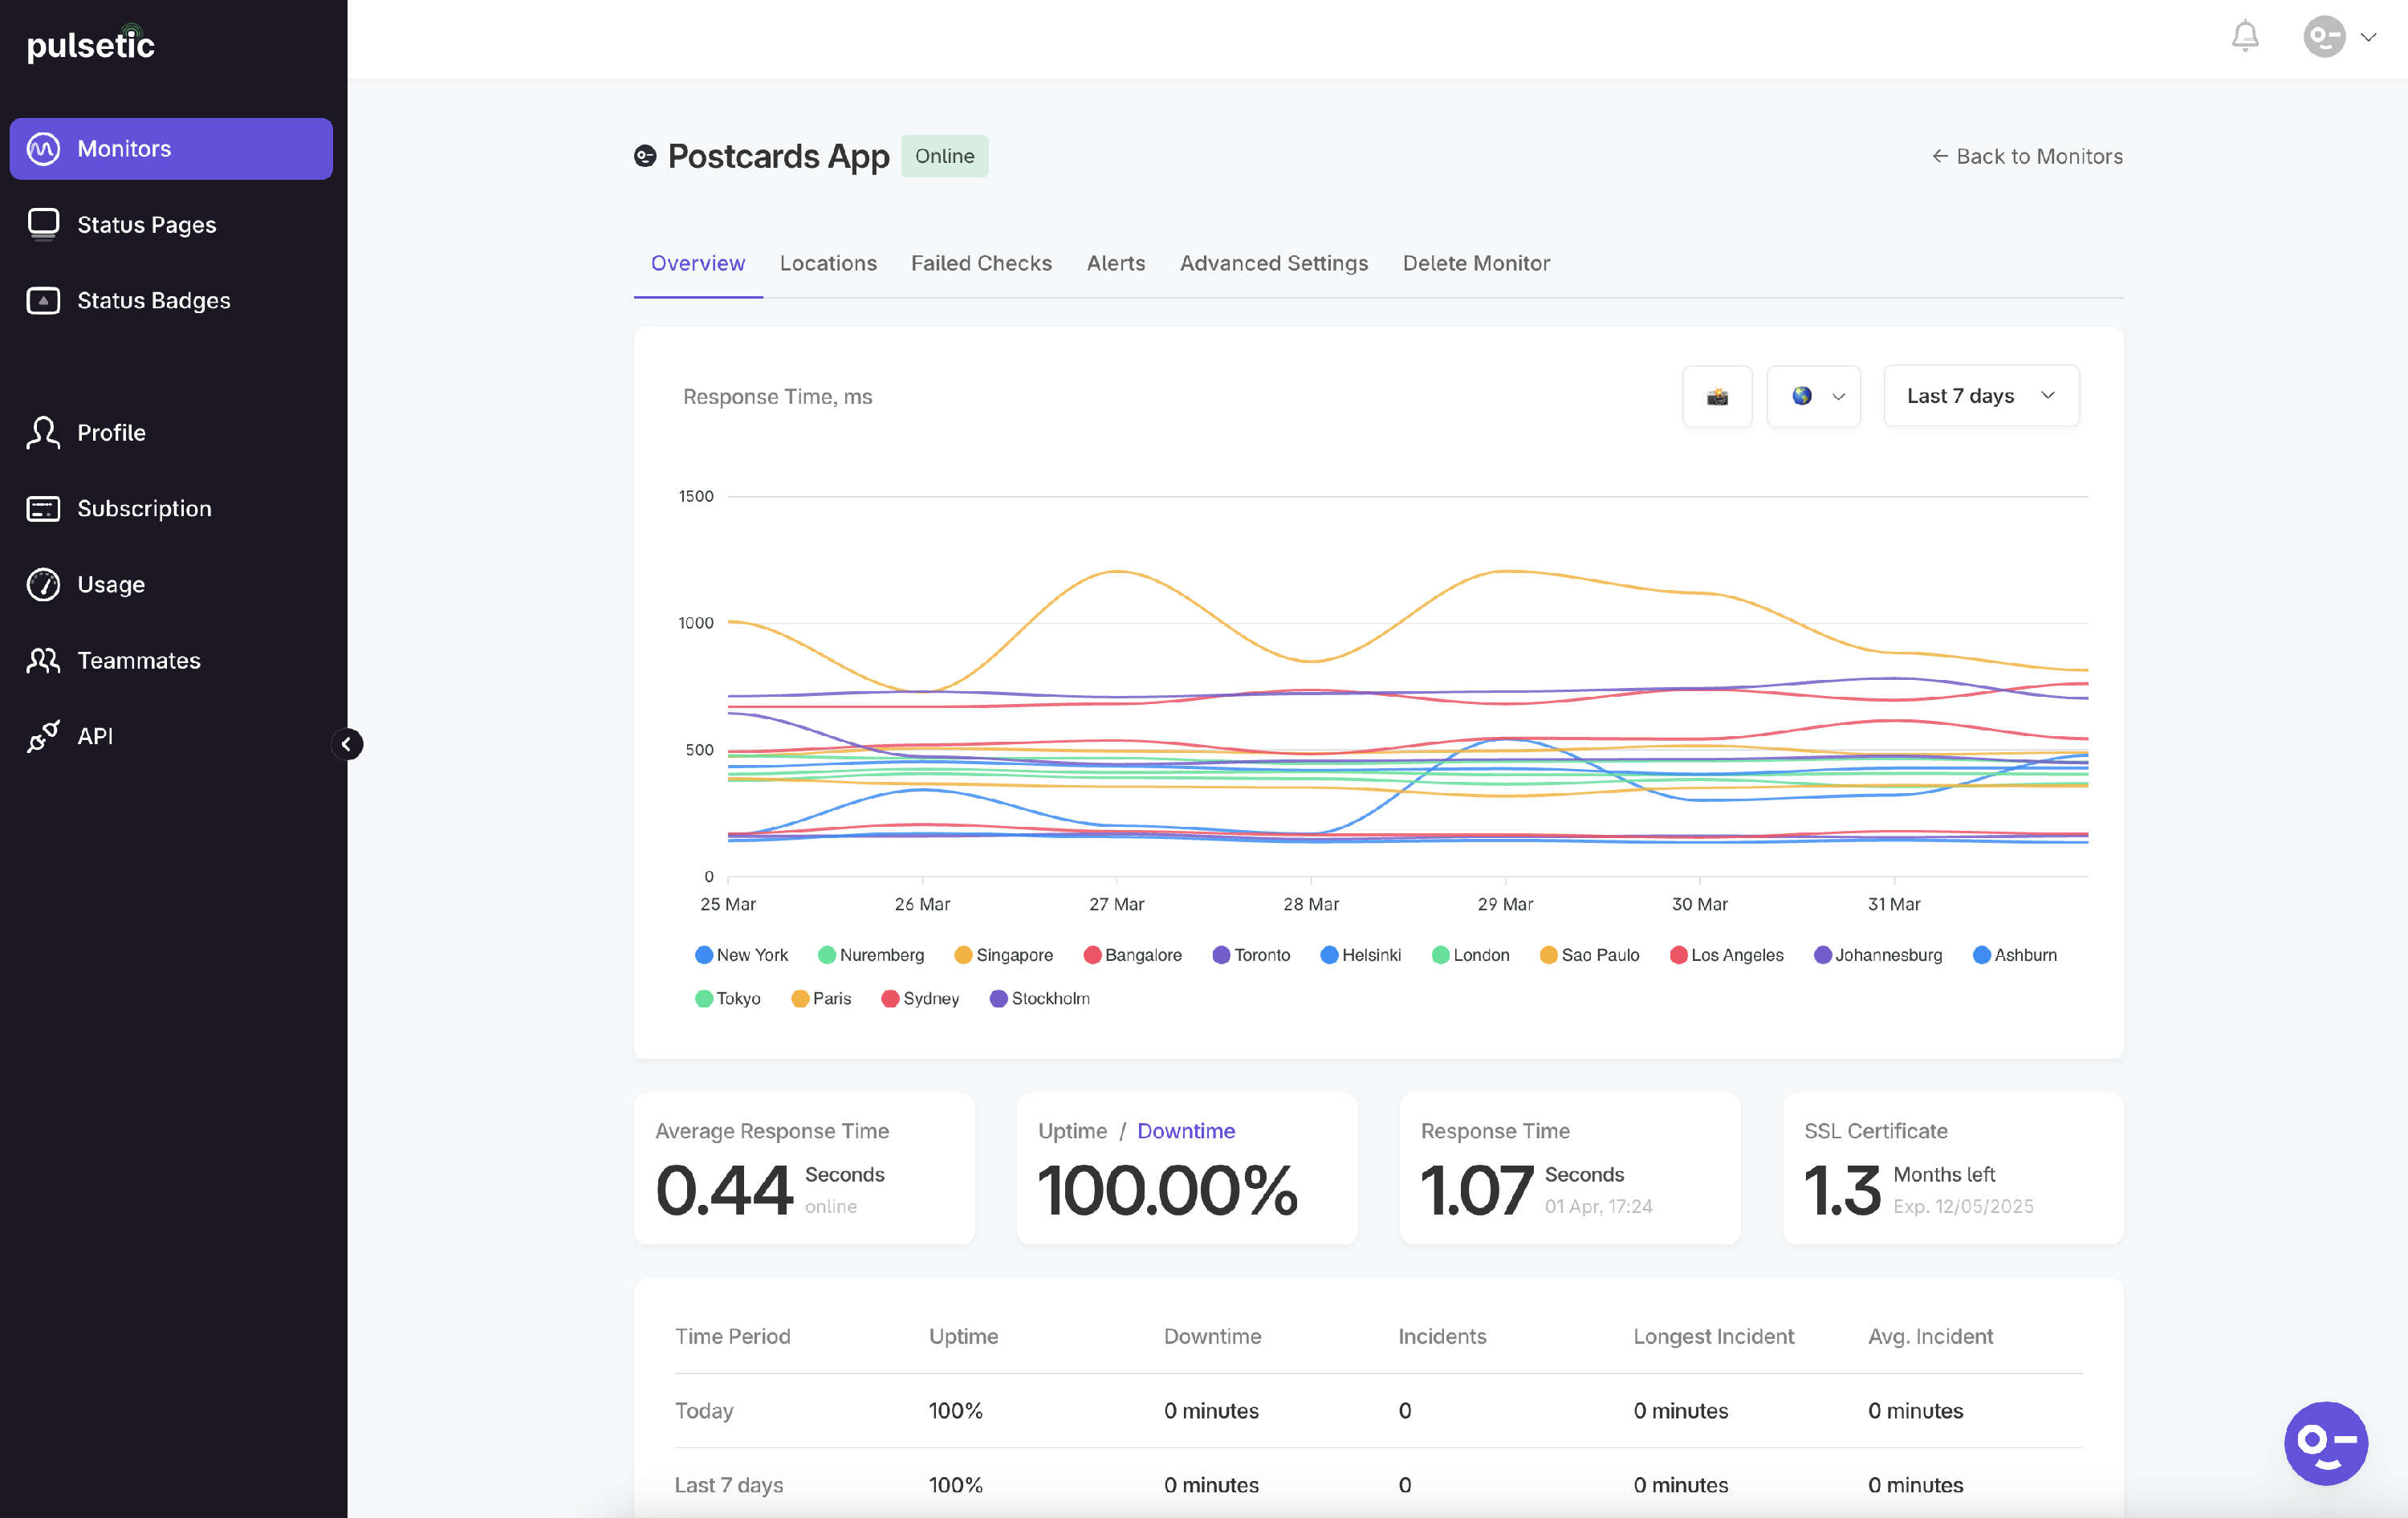
- Monitor Reports: Detailed reports that dive deep into performance metrics.
These views help you identify trends and resolve issues promptly. Pulsetic's automated monitoring and instant alerts ensure you're always informed about your website's status.
Dashboard
This is the overview, and also where you can add websites to be monitored. Adding a new monitor is straightforward. For detailed instructions, please refer to our tutorial here. Once added, your monitors appear on the Monitors dashboard, giving you instant visibility into:
- Name: The name or URL of the monitored website or API.
- Status: Clear indicators showing if your site is online or not.
- Certificate: Information about the website's SSL certificate status.
- Uptime: The website's current uptime percentage.
- Latest Check: The time and date of the most recent monitoring check.

Monitor Reports
Clicking on a website's URL in the Monitors list reveals detailed report tabs:
- Overview: Key metrics including response time, uptime, SSL status, performance, and SEO.
- Locations: Regional uptime and response time breakdowns.
- Failed Checks: Records of monitoring failures with error codes.
- Alerts: Configuration for notifications about downtime or performance issues.
- Advanced Settings: Developer tools for HTTP request and response customization.
- Delete Monitor: Option to remove a website from monitoring.

Whether you need the big picture or specific details, Pulsetic gives you both in one easy-to-use interface. The Monitors page keeps you informed without overwhelming you with technical complexity.
For more information on the Overview page, refer to this link: Understanding Your Monitor Overview.
