Port Monitoring
When you configure port monitoring, Pulsetic attempts to establish a TCP connection to the specified IP address or hostname on the port you define. A successful connection indicates that the service on that port is likely running and accessible. A failed connection suggests a potential issue with the service, network connectivity, or firewall rules.
Steps to Set Up Port Monitoring
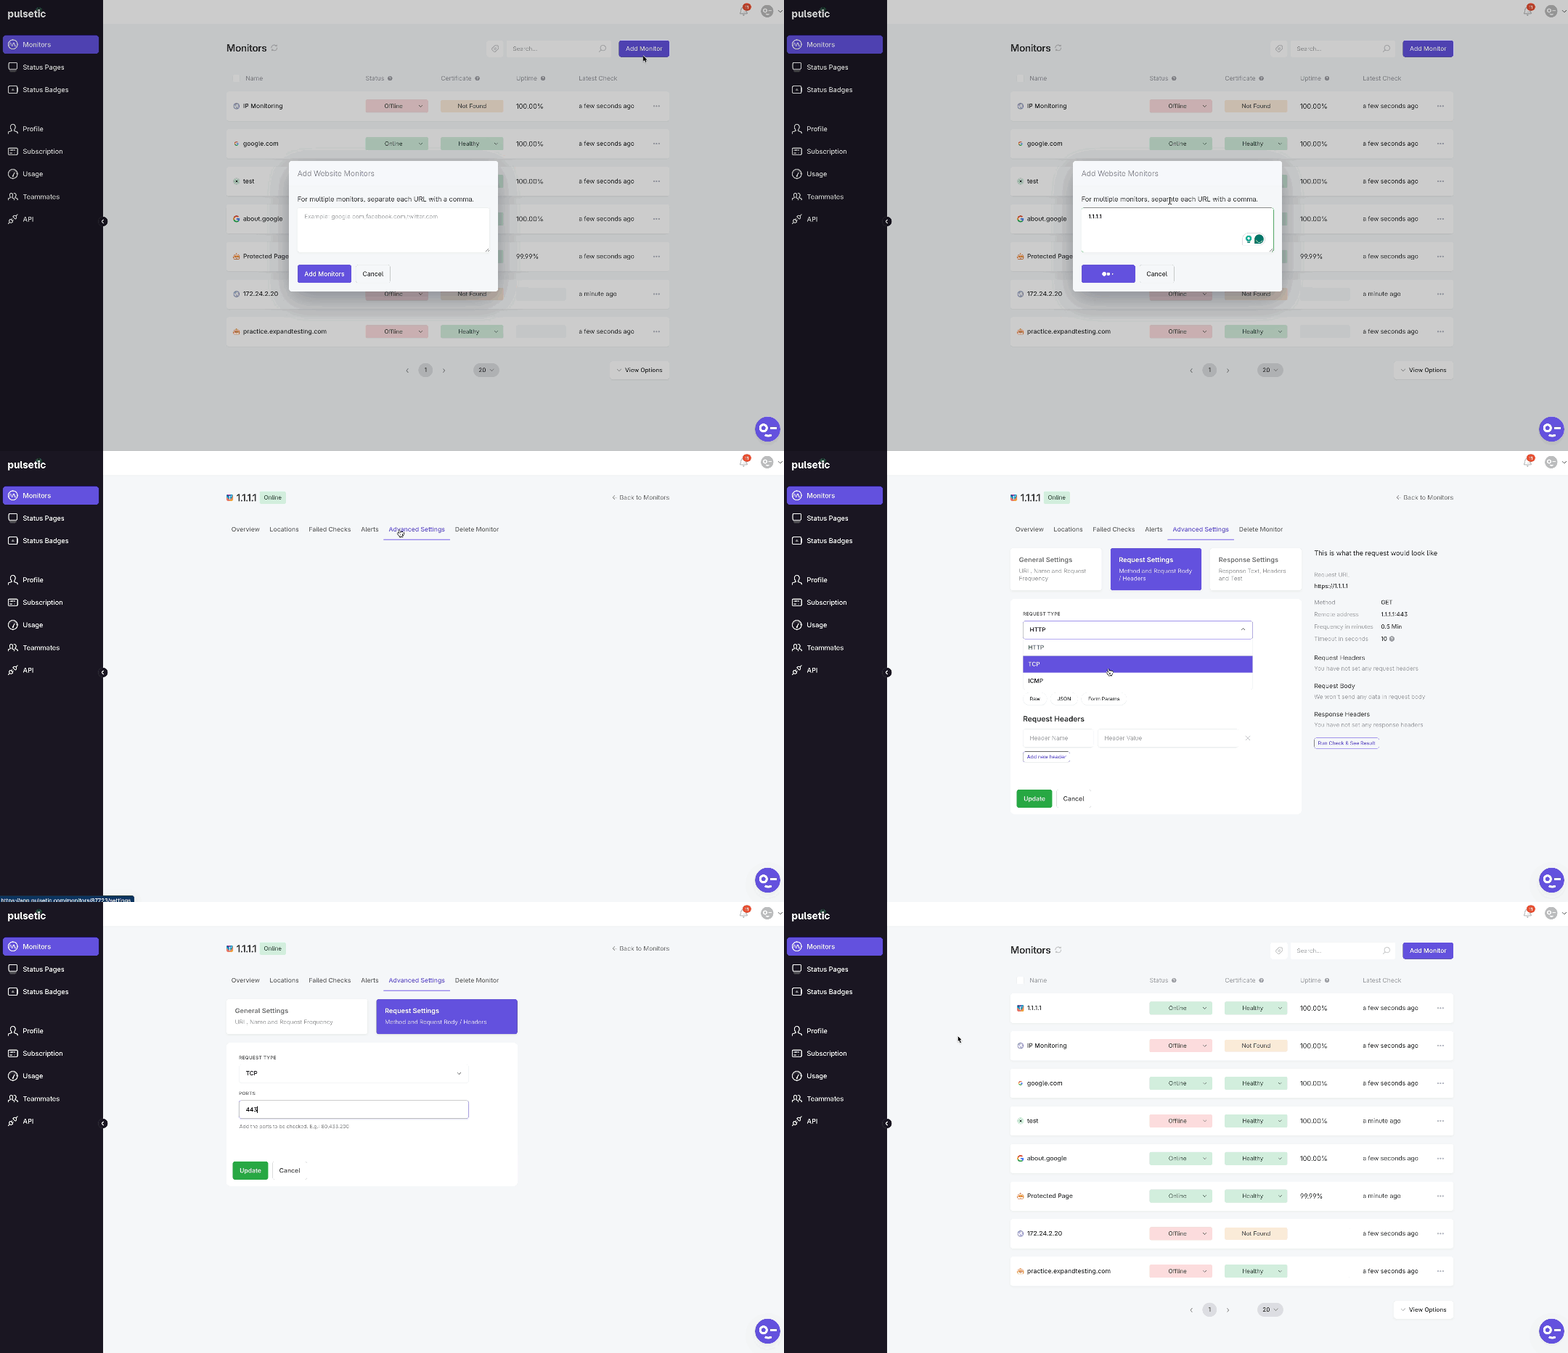
- Navigate to the Monitors tab, then select Add Monitor.
- Type the IP address that you want to monitor, then select Add Monitors.
- In your Pulsetic dashboard, locate the monitor you created for your VPS IP address and click on it to access its details.
- Look for the Advanced Settings option and select it.
- Within the Advanced Settings, select Request Settings to specify the type of monitoring you want to configure.
- Under Request Settings choose the TCP option. This indicates that you want to monitor a specific TCP port.
- In the Ports field, enter the port number relevant to the service you want to monitor. For example:
80for HTTP443for HTTPS22for SSH3306for MySQL5432for PostgreSQL

Important Note on Initial Monitor Status
When you initially add your monitor, it might be marked as failed because Pulsetic defaults to HTTP checks. Don't worry! Once you configure the Request Settings to "TCP" and enter the desired port, the system will begin checking that specific port, and the status should update to reflect its actual availability.
