Integrating Pulsetic Alerts with Datadog
Stop treating uptime tracking and server monitoring as separate silos. When a critical monitor goes offline, your engineering team shouldn't have to scramble to align timestamps across different dashboards to figure out what broke.
By connecting Pulsetic directly to Datadog, you pipe your external availability data straight into your primary engineering hub, creating a single source of truth for incident response.
Why Connect Pulsetic to Datadog?
The core use case is accelerated root-cause analysis.
Pulsetic monitors the external symptom (e.g., your users in Europe are getting a 502 Bad Gateway error). Datadog monitors the internal cause (e.g., your Kubernetes pod crashed, or database CPU spiked to 100%).
By sending Pulsetic alerts into your Datadog Event Stream, you create a unified timeline. If Pulsetic reports downtime at exactly 2:04 PM, and Datadog shows a database deployment at 2:03 PM, the root cause is immediately obvious. Furthermore, this allows you to trigger your existing Datadog routing workflows (like waking up an engineer via PagerDuty) using Pulsetic's external downtime detection.
Datadog Integration Process
Step 1: Generate a Datadog API Key
To allow Pulsetic to securely send data, you must generate a dedicated API key inside Datadog.
-
Log into your Datadog account. Click your profile picture or organization name in the bottom-left corner.
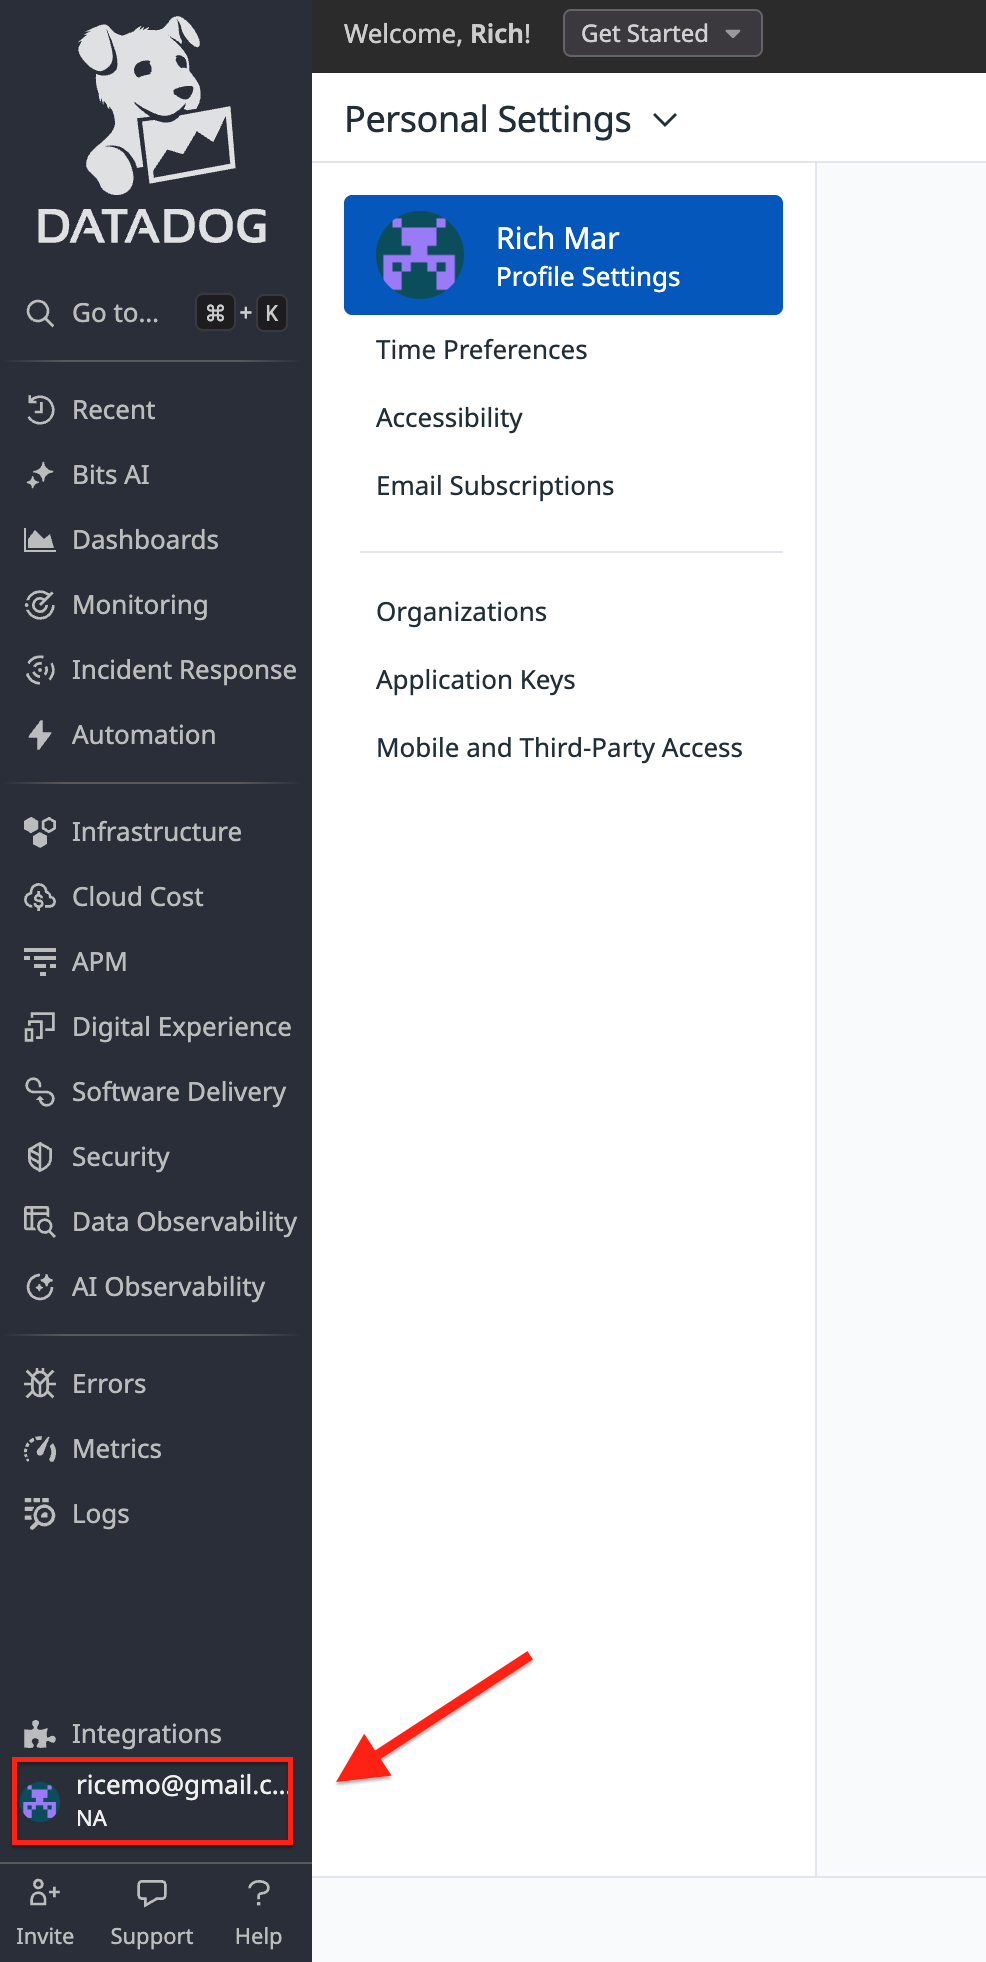
-
Select Organization Settings. From the left-hand menu, click API Keys
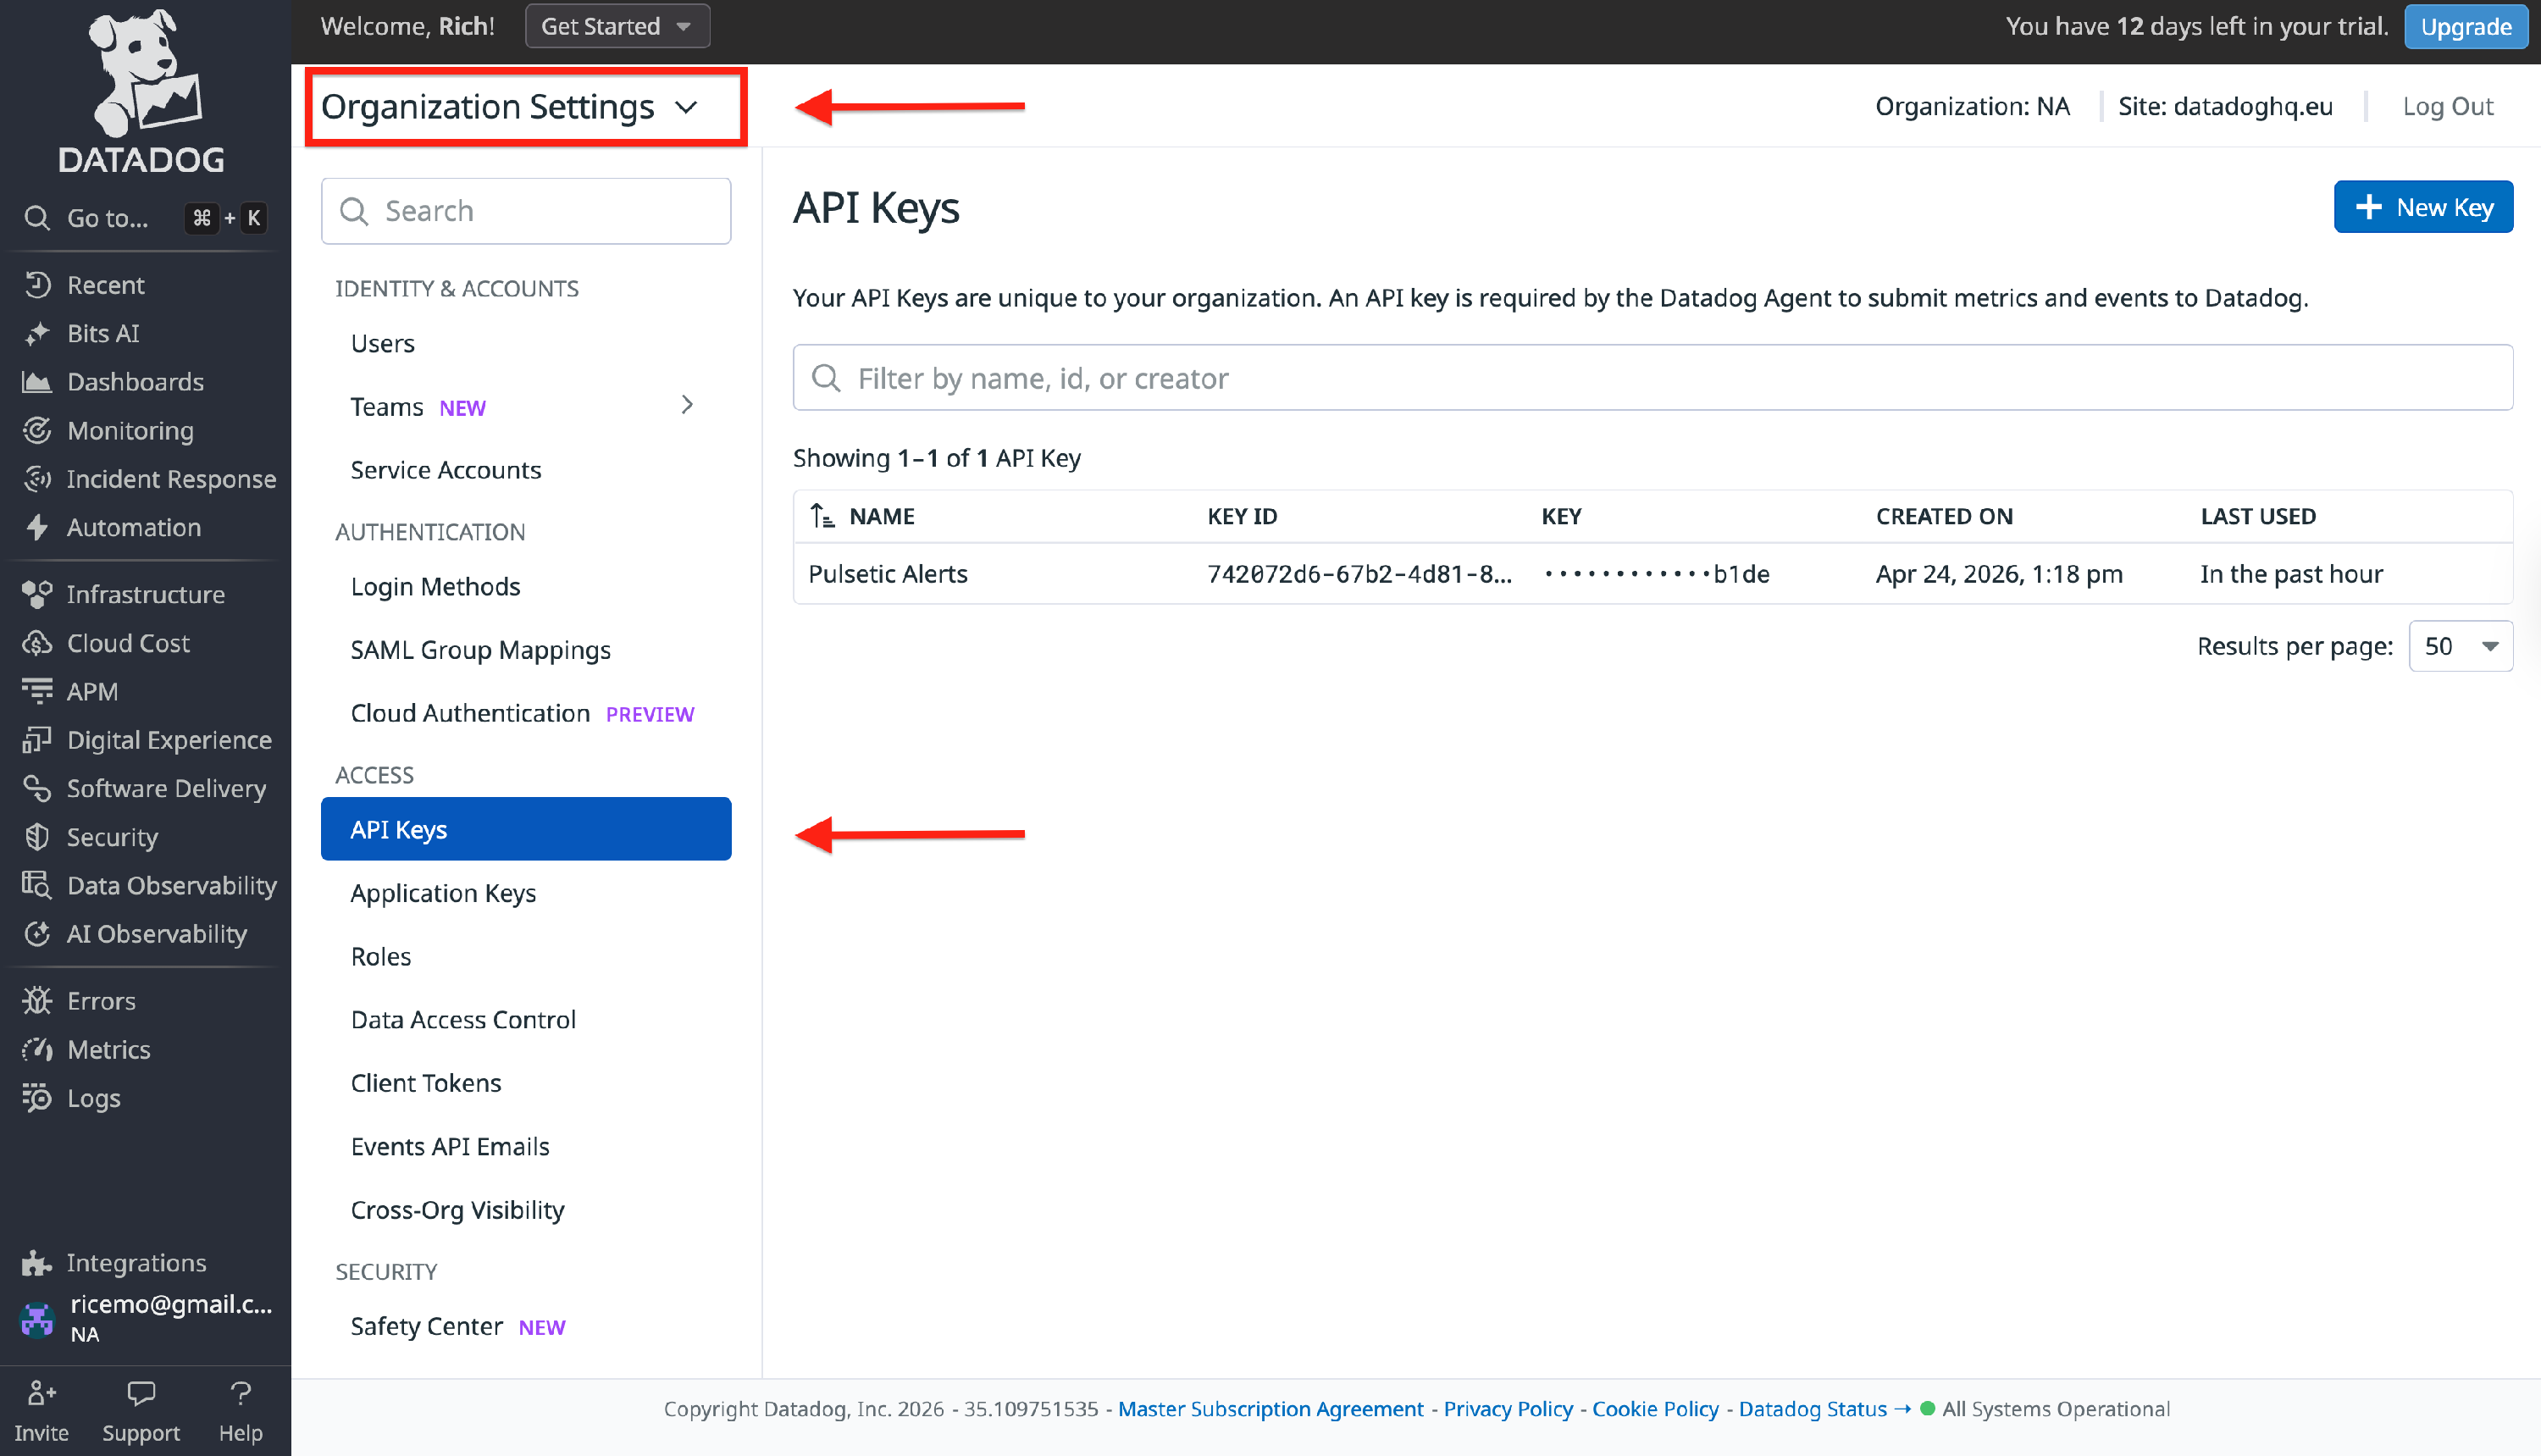
- Click the New Key button in the top right. Name it something identifiable, such as
Pulsetic-Alerts, so you know exactly what it's for during future security audits. - Click Create Key, then copy the generated alphanumeric string.


Note:
Ensure you are generating an API Key, not an Application Key. API keys are used to submit data to Datadog; App keys are used to pull data out.
Step 2: Configure Pulsetic & Send Test Requests
Next, we tell Pulsetic where to send your downtime alerts.
- Log into Pulsetic. Select the monitor you want to connect and set the alert.
- Scroll down to the Datadog option. Paste the API Key you copied in Step 1.
-
Datadog operates several isolated data centers. You must select the region that matches the URL you use to log into Datadog (e.g., if your URL is
app.datadoghq.eu, select EU1).
- Send the Tests: Within the Datadog setup block in Pulsetic, you will see two buttons.
- Click Send offline request to simulate a downtime event.
- Click Send online request to simulate a recovery event.


Note:
Why run both tests? Datadog treats these as two entirely different events based on their tags (status:offline vs. status:online ). Firing both now ensures you have live data in your Datadog Event Stream to help you build your monitor in the next step.
Step 3: Datadog Verification
Unlike Slack or email integrations which send human-readable messages, Datadog receives these tests as raw data points called Events. Here is how to find them and prove the integration works.
-
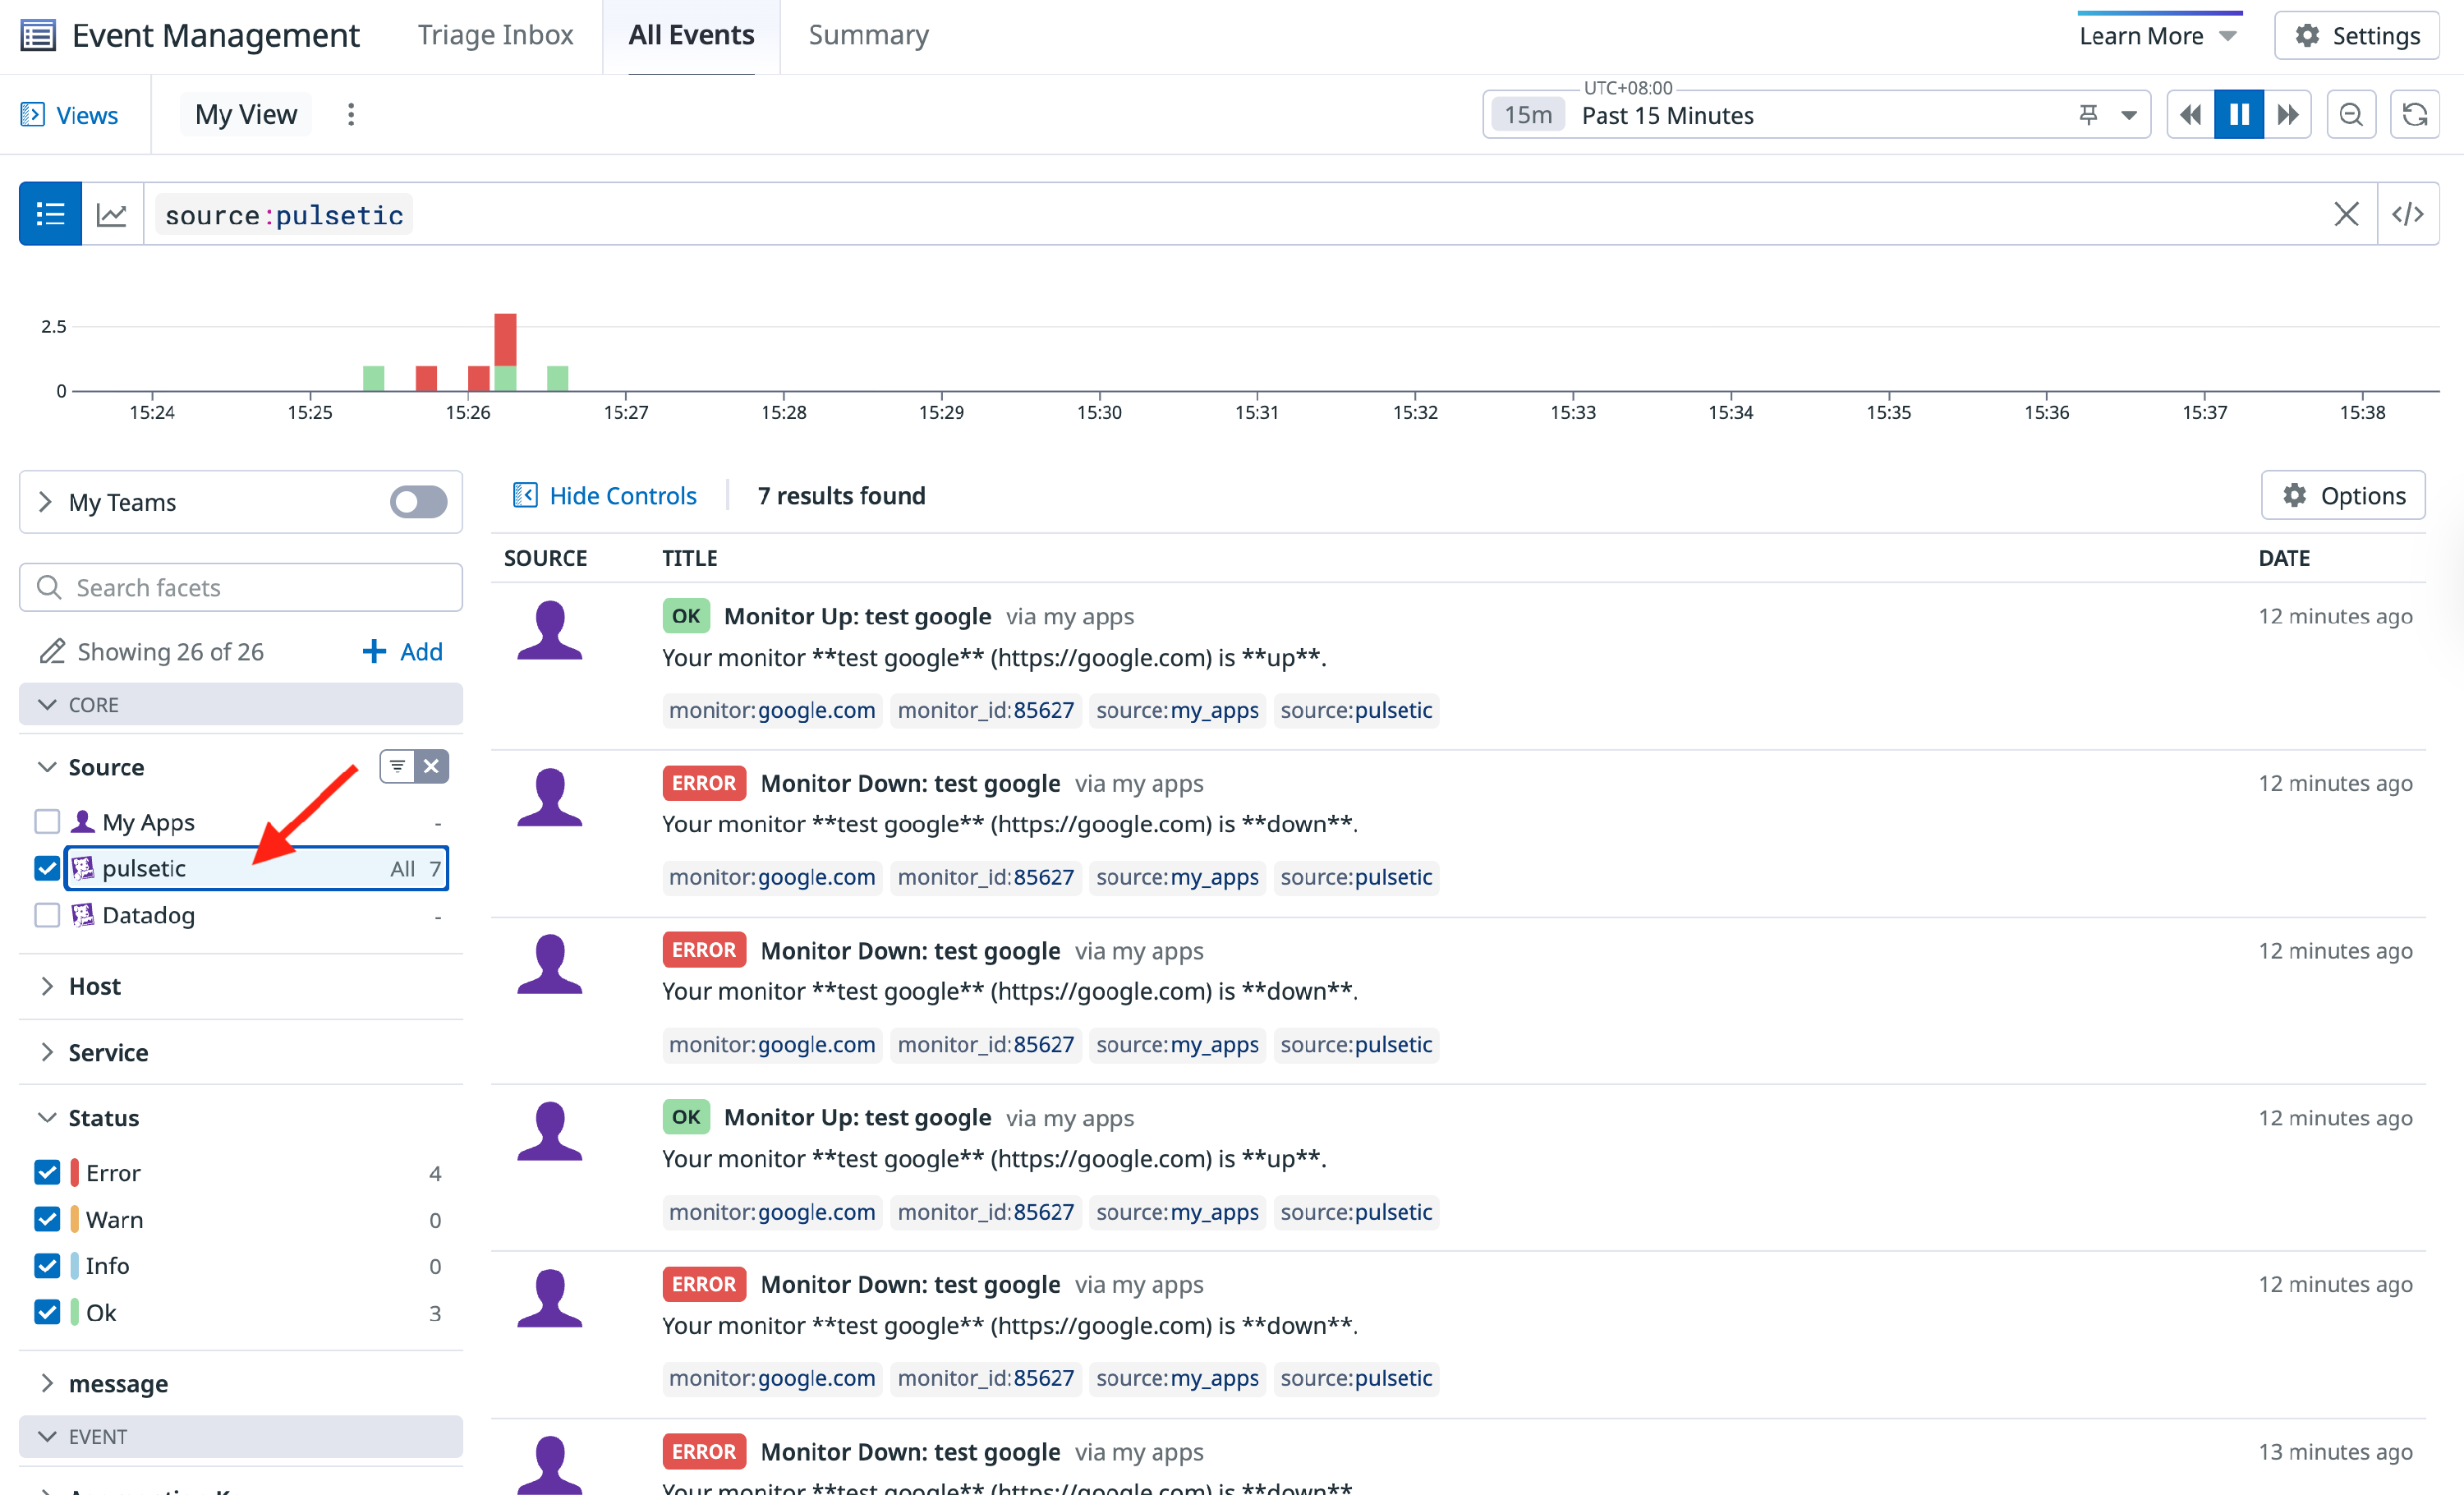
Go back to your Datadog dashboard. In the left-hand navigation menu, click on Monitoring. Locate Event Management, and click on All Events.
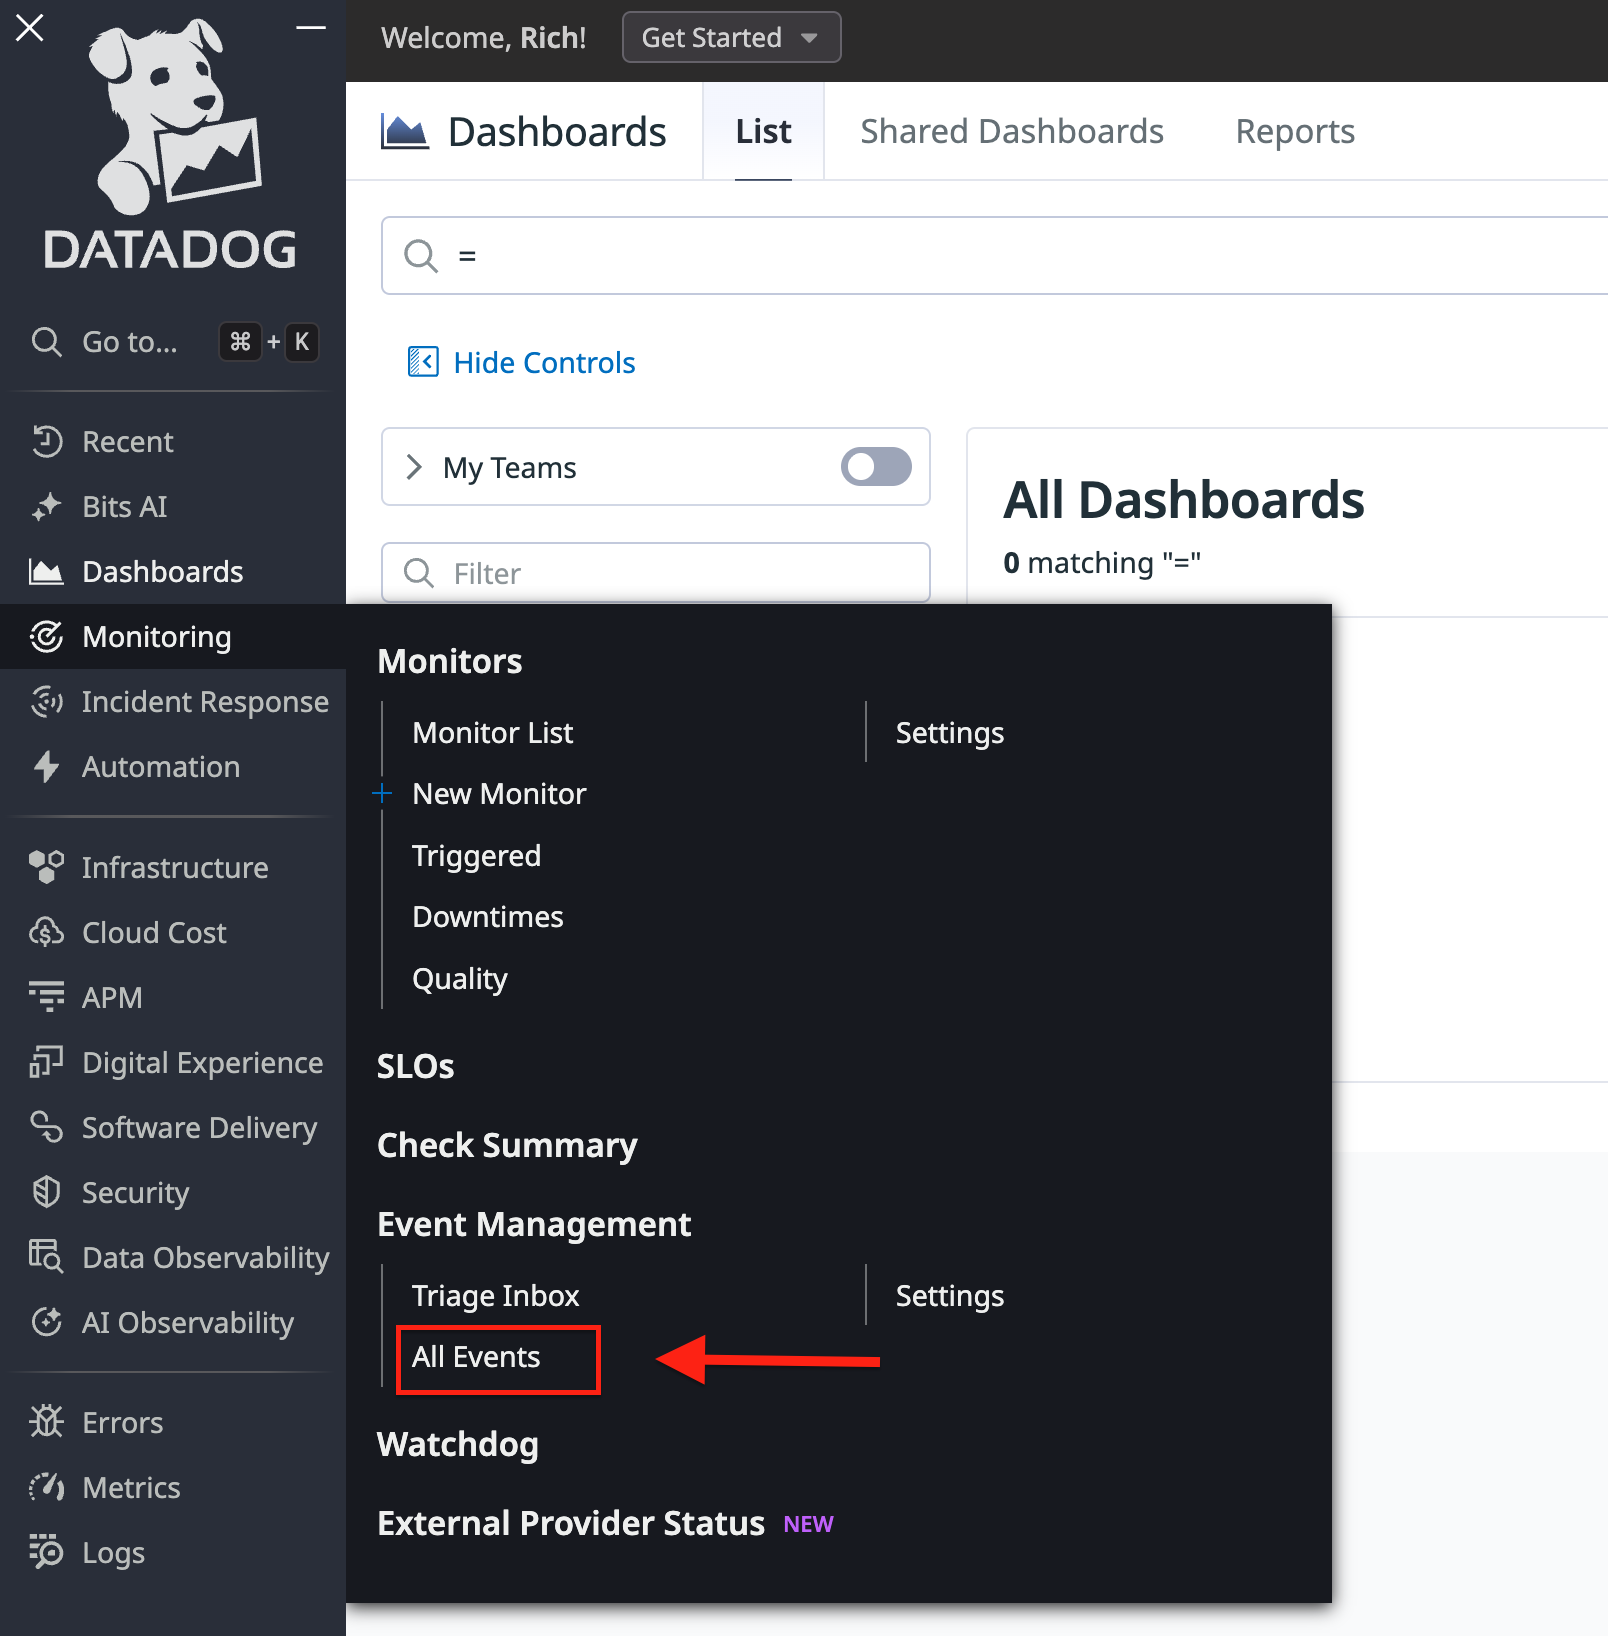
- Datadog's event stream can be very noisy. To find your tests immediately, click the search bar at the top and type exactly:
source:pulseticor locate the Source section and select pulsetic. -
You should see your two test events populate in the timeline.


Note:
For a deeper dive into how Datadog ingests, filters, and formats this data, you can refer to the official Datadog Event Management Documentation.