
How to Set Up a Real User Monitoring (RUM)
Real User Monitoring (RUM) tracks and analyzes the actual performance and experience of visitors interacting with your website. Instead of running simulated checks, RUM collects data from real browsers to help you monitor page load times, catch JavaScript errors, and track Core Web Vitals.
Why use this? RUM ensures your website performs perfectly for your actual users across different devices, browsers, and geographic locations. If users experience slow load times or broken scripts, you will know exactly where and why it is happening.
Pulsetic monitors key performance metrics such as Largest Contentful Paint (LCP), Interaction to Next Paint (INP), Time to First Byte (TTFB), Cumulative Layout Shift (CLS), page load time, JavaScript errors, HTTP errors, and overall error rates.
For detailed information about supported metrics, alert thresholds, alert lifecycles, recovery behavior, and notification channels, see Real User Monitoring Alerts.
How to Setup Real User Monitoring (RUM)
Step 1: Access RUM and Add a Website
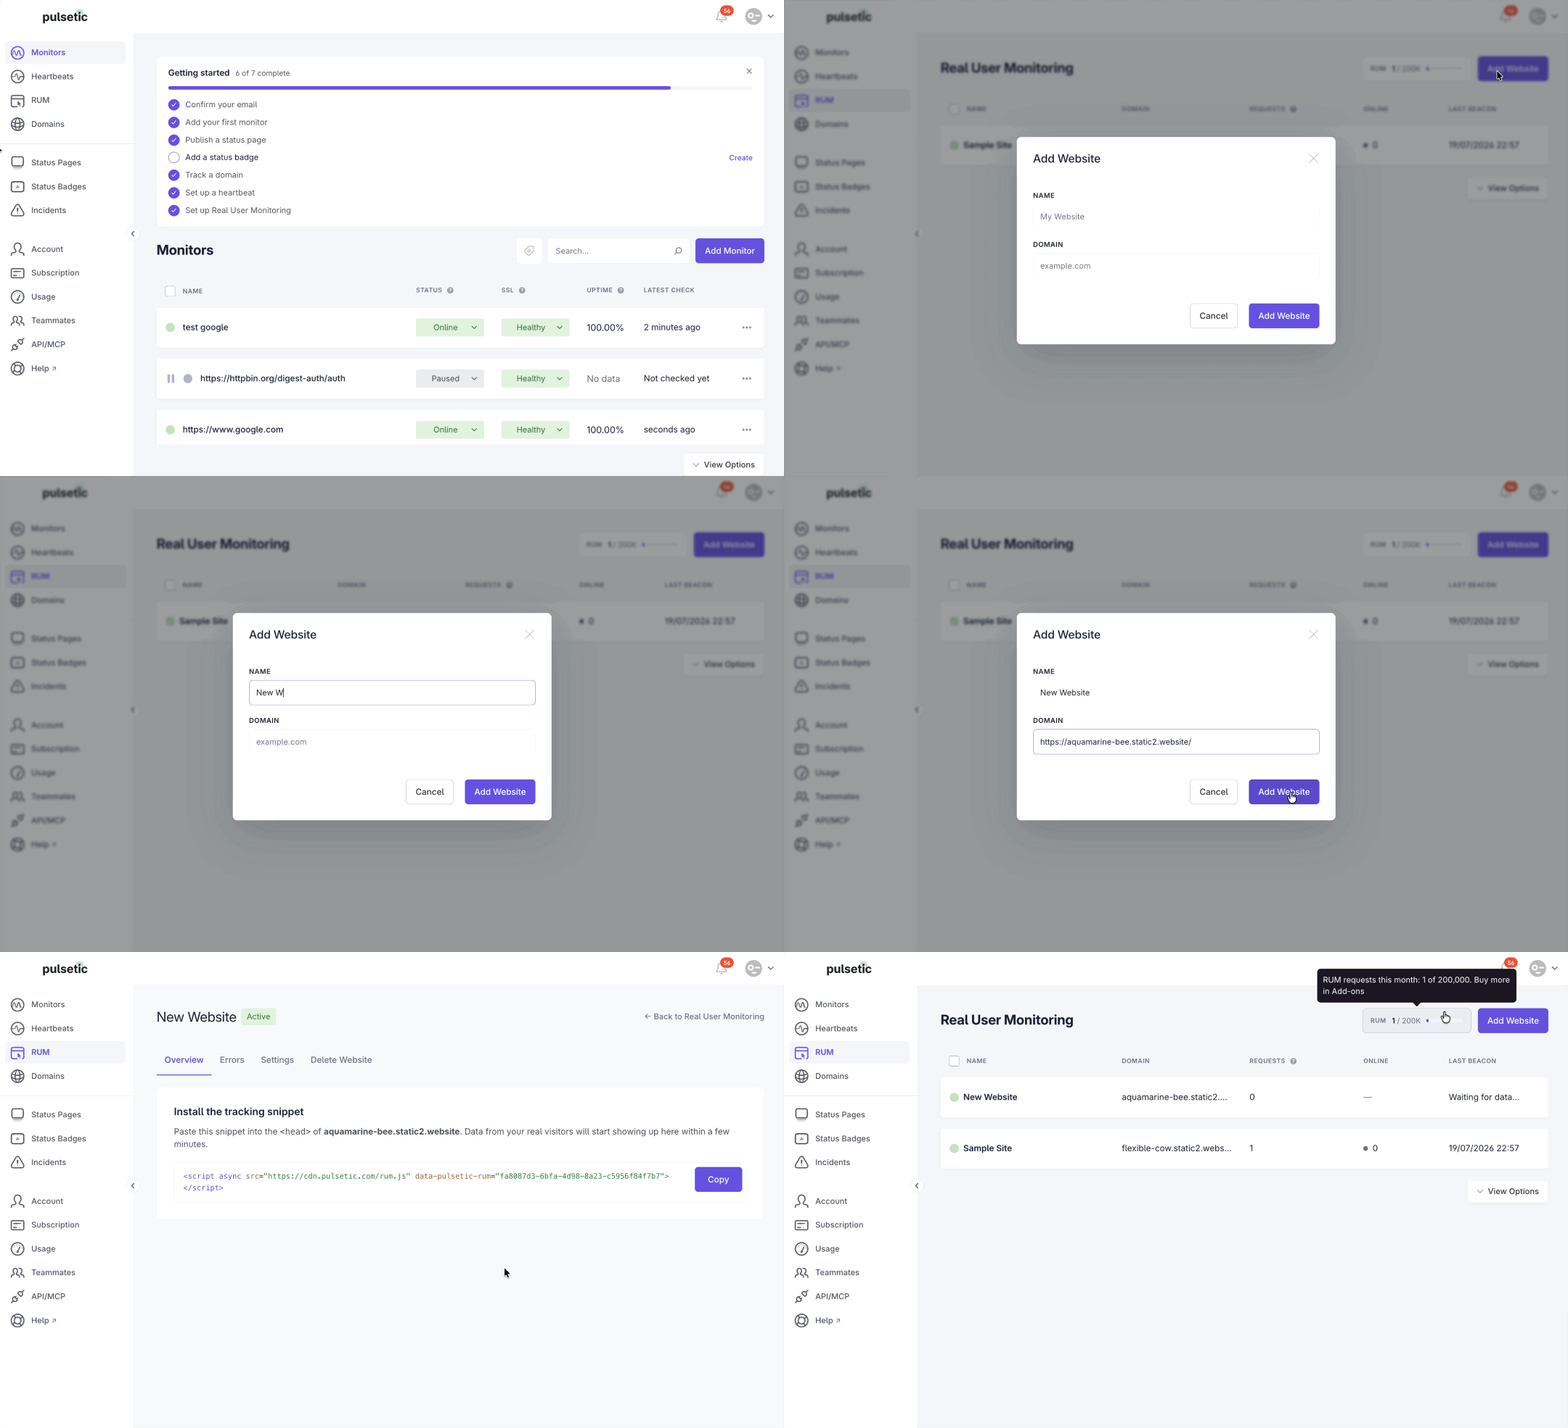
- Log in to your Pulsetic account. In the left-hand navigation sidebar, click on RUM.
- Check your current usage statistics (e.g., 0 / 200K) at the top of the page to monitor your request volume against your account limits.
- Click the Add Website button at the top of the dashboard.
- Enter the Name and Domain of the website.
- Your site will appear in your list with its status showing as Waiting for data... until the tracking code is installed.
Step 2: Install the Tracking Snippet
- From the RUM dashboard, click on your newly added website to open its details.
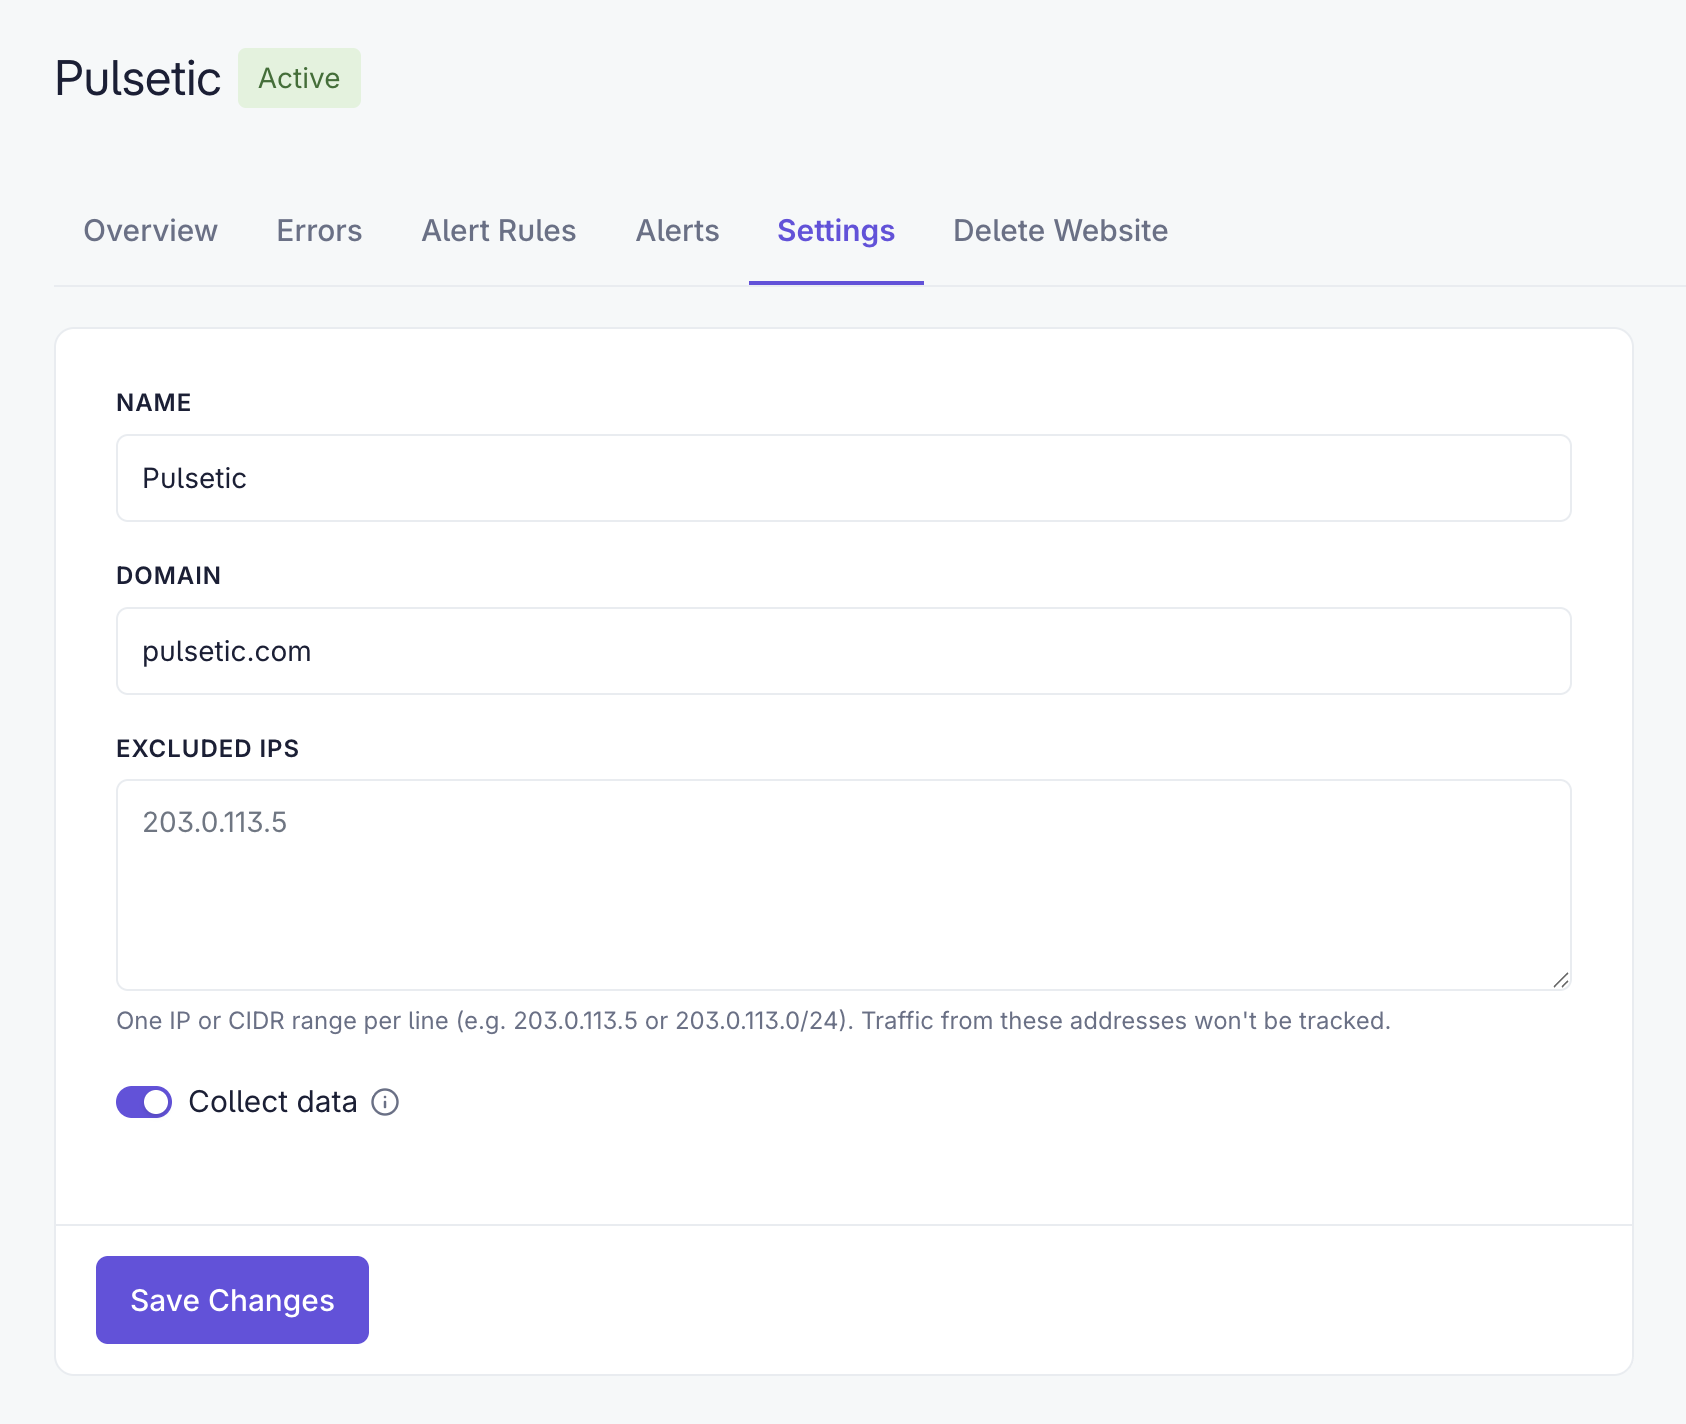
- Navigate to the Settings tab.
- Ensure the Collect data toggle is active.
- Locate the Install the tracking snippet section. You will see a script tag unique to your domain, looking similar to this:
- Copy this snippet and paste it directly into the
<head>section of your website’s HTML. - Click Save Changes. Data from your real visitors will begin appearing within a few minutes.
Step 3: Navigating the Main RUM Dashboard
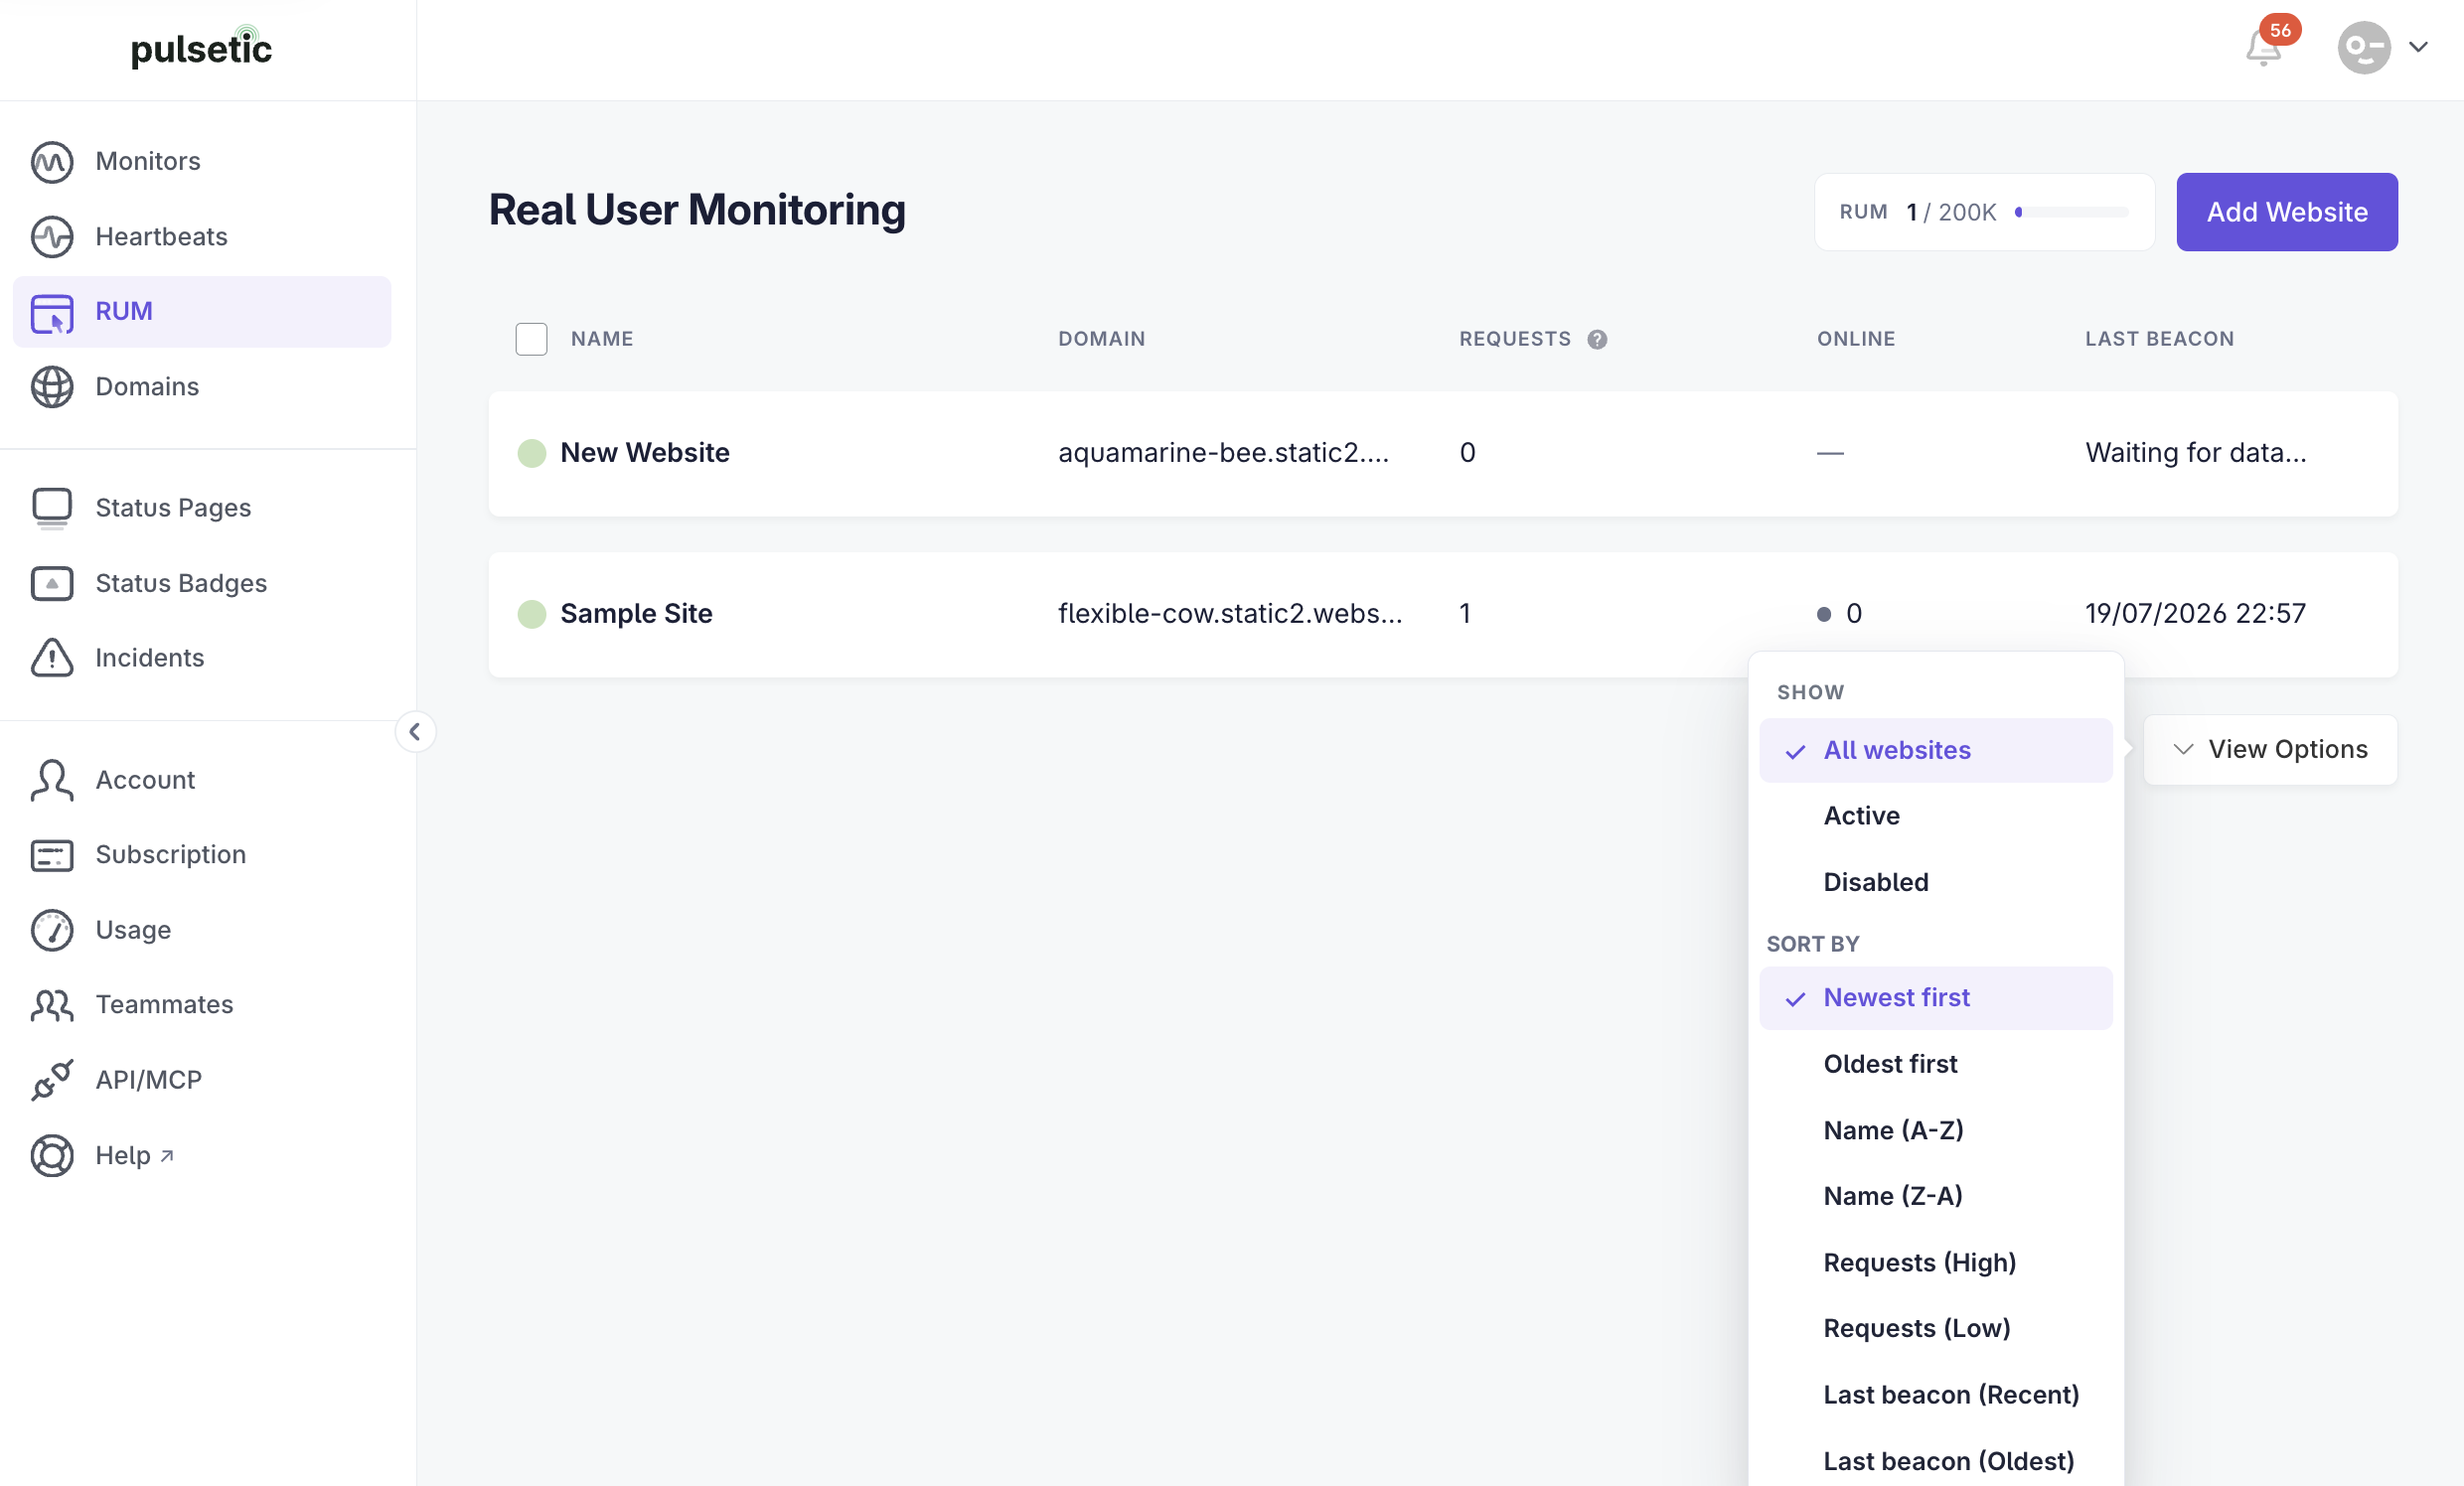
- Name & Domain: The label you assigned (e.g., Sample Website) and the specific web address (e.g., www.sampledomain.com).
- Excluded IPs: Use Excluded IPs to prevent traffic from specific IP addresses or IP ranges from being tracked on RUM. This is useful for excluding internal traffic, such as visits from your office, team members, developers, or automated systems, so it does not affect your analytics.
- Requests: The total number of user requests currently tracked.
- Online: The number of users currently active on the site.
- Last beacon: The most recent time data was received from a user's browser.
- Show: Filter your list by All websites, Active, or Disabled.
- Sort by: Organize the list by Newest first, Oldest first, Name (A-Z or Z-A), Requests (High or Low), or Last beacon (recent or oldest).
Step 4: Analyze Website Data
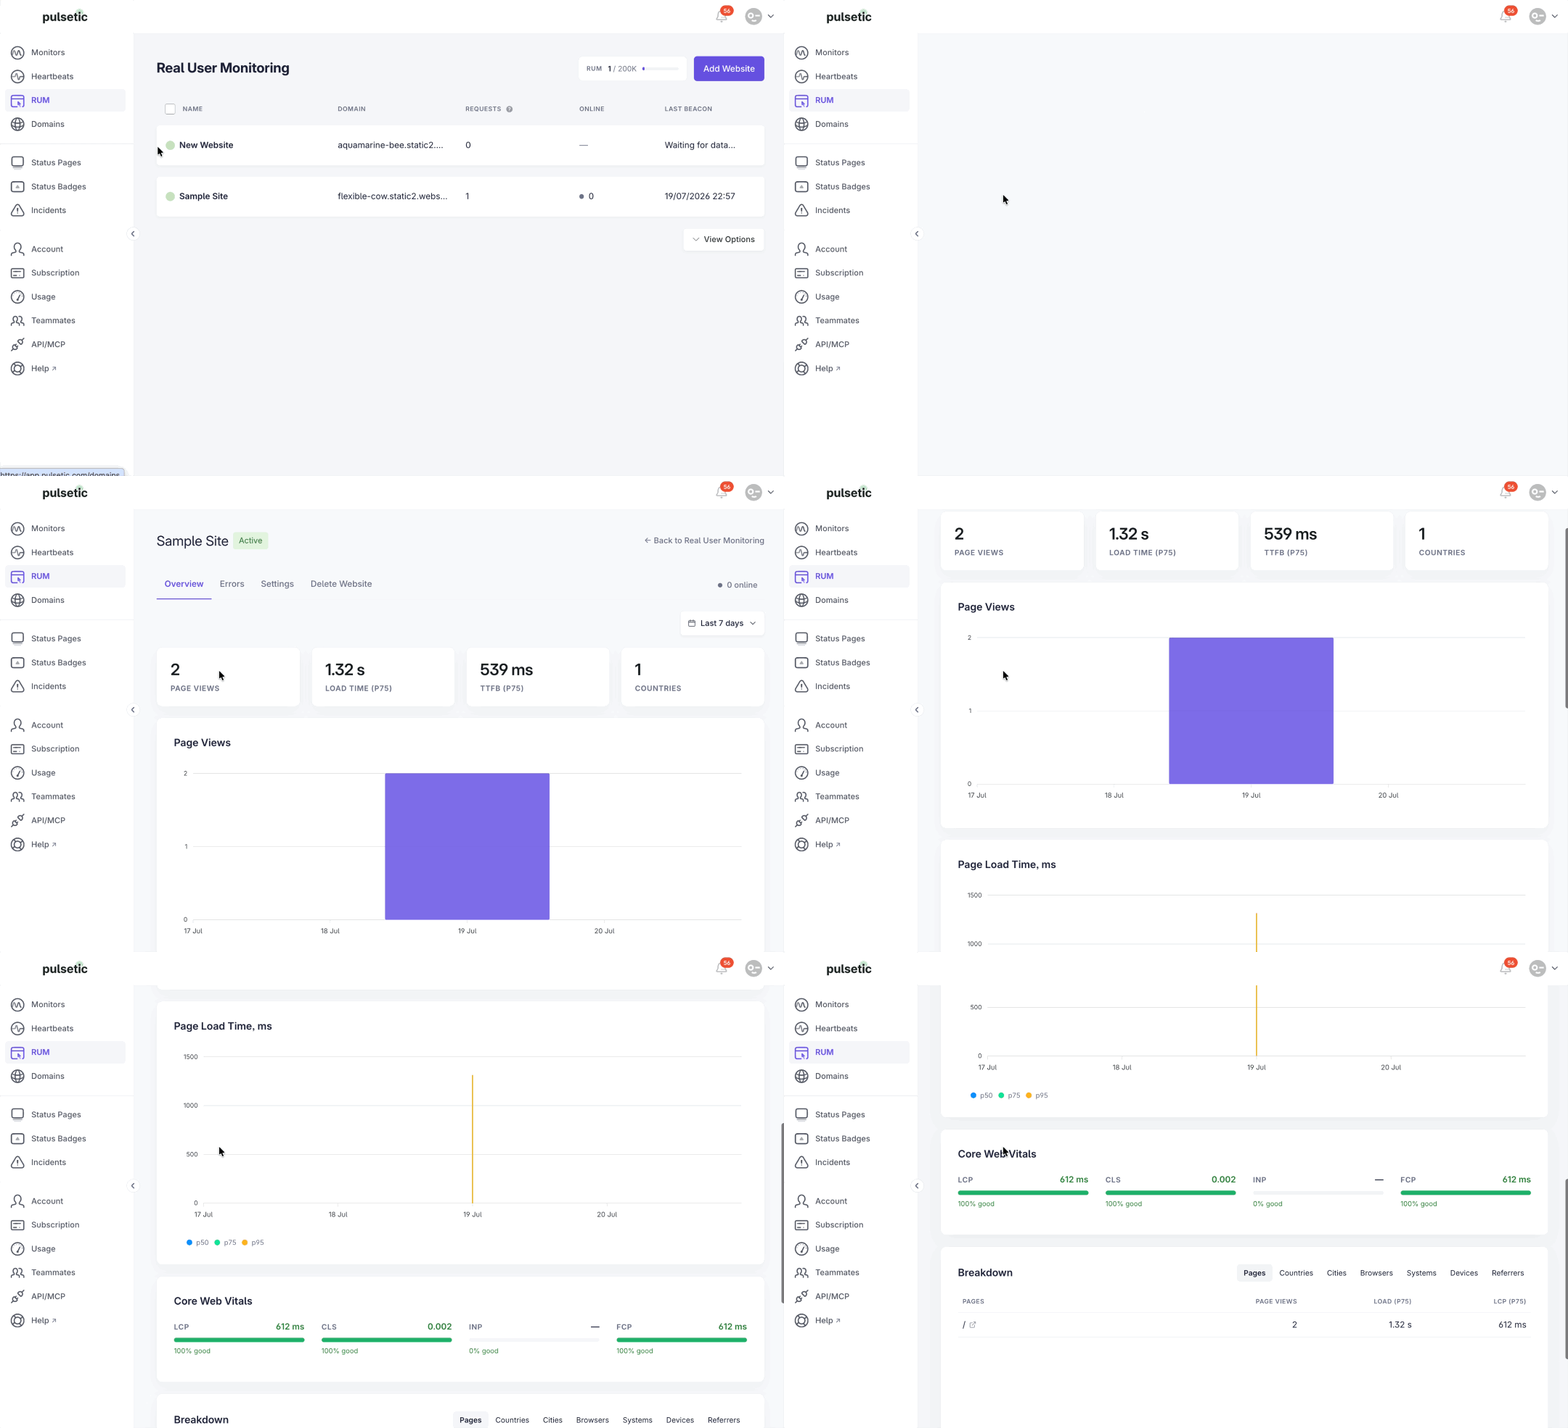
- Top-Level Metrics: Quickly view total Page Views, Load Time (at the 75th percentile/p75), TTFB (Time to First Byte at p75), and the total number of Countries your visitors represent.
- Performance Graphs: Visualize Page Views and Page Load Time (in milliseconds) charted across p50, p75, and p95 percentiles to understand average and slower loading experiences.
- Core Web Vitals: Monitor key Google performance metrics, including LCP (Largest Contentful Paint), CLS (Cumulative Layout Shift), INP (Interaction to Next Paint), and FCP (First Contentful Paint). Pulsetic grades these scores (e.g., "100% good").
- Traffic Breakdowns: Filter and analyze your audience by Pages, Countries, Cities, Browsers, Systems, Devices, and Referrers.
- Total Errors, JavaScript Errors, and HTTP Errors.
- Errors / 100 Views to measure error frequency against your total traffic.
- Errors Over Time feeds to help your development team troubleshoot specific front-end or network issues.
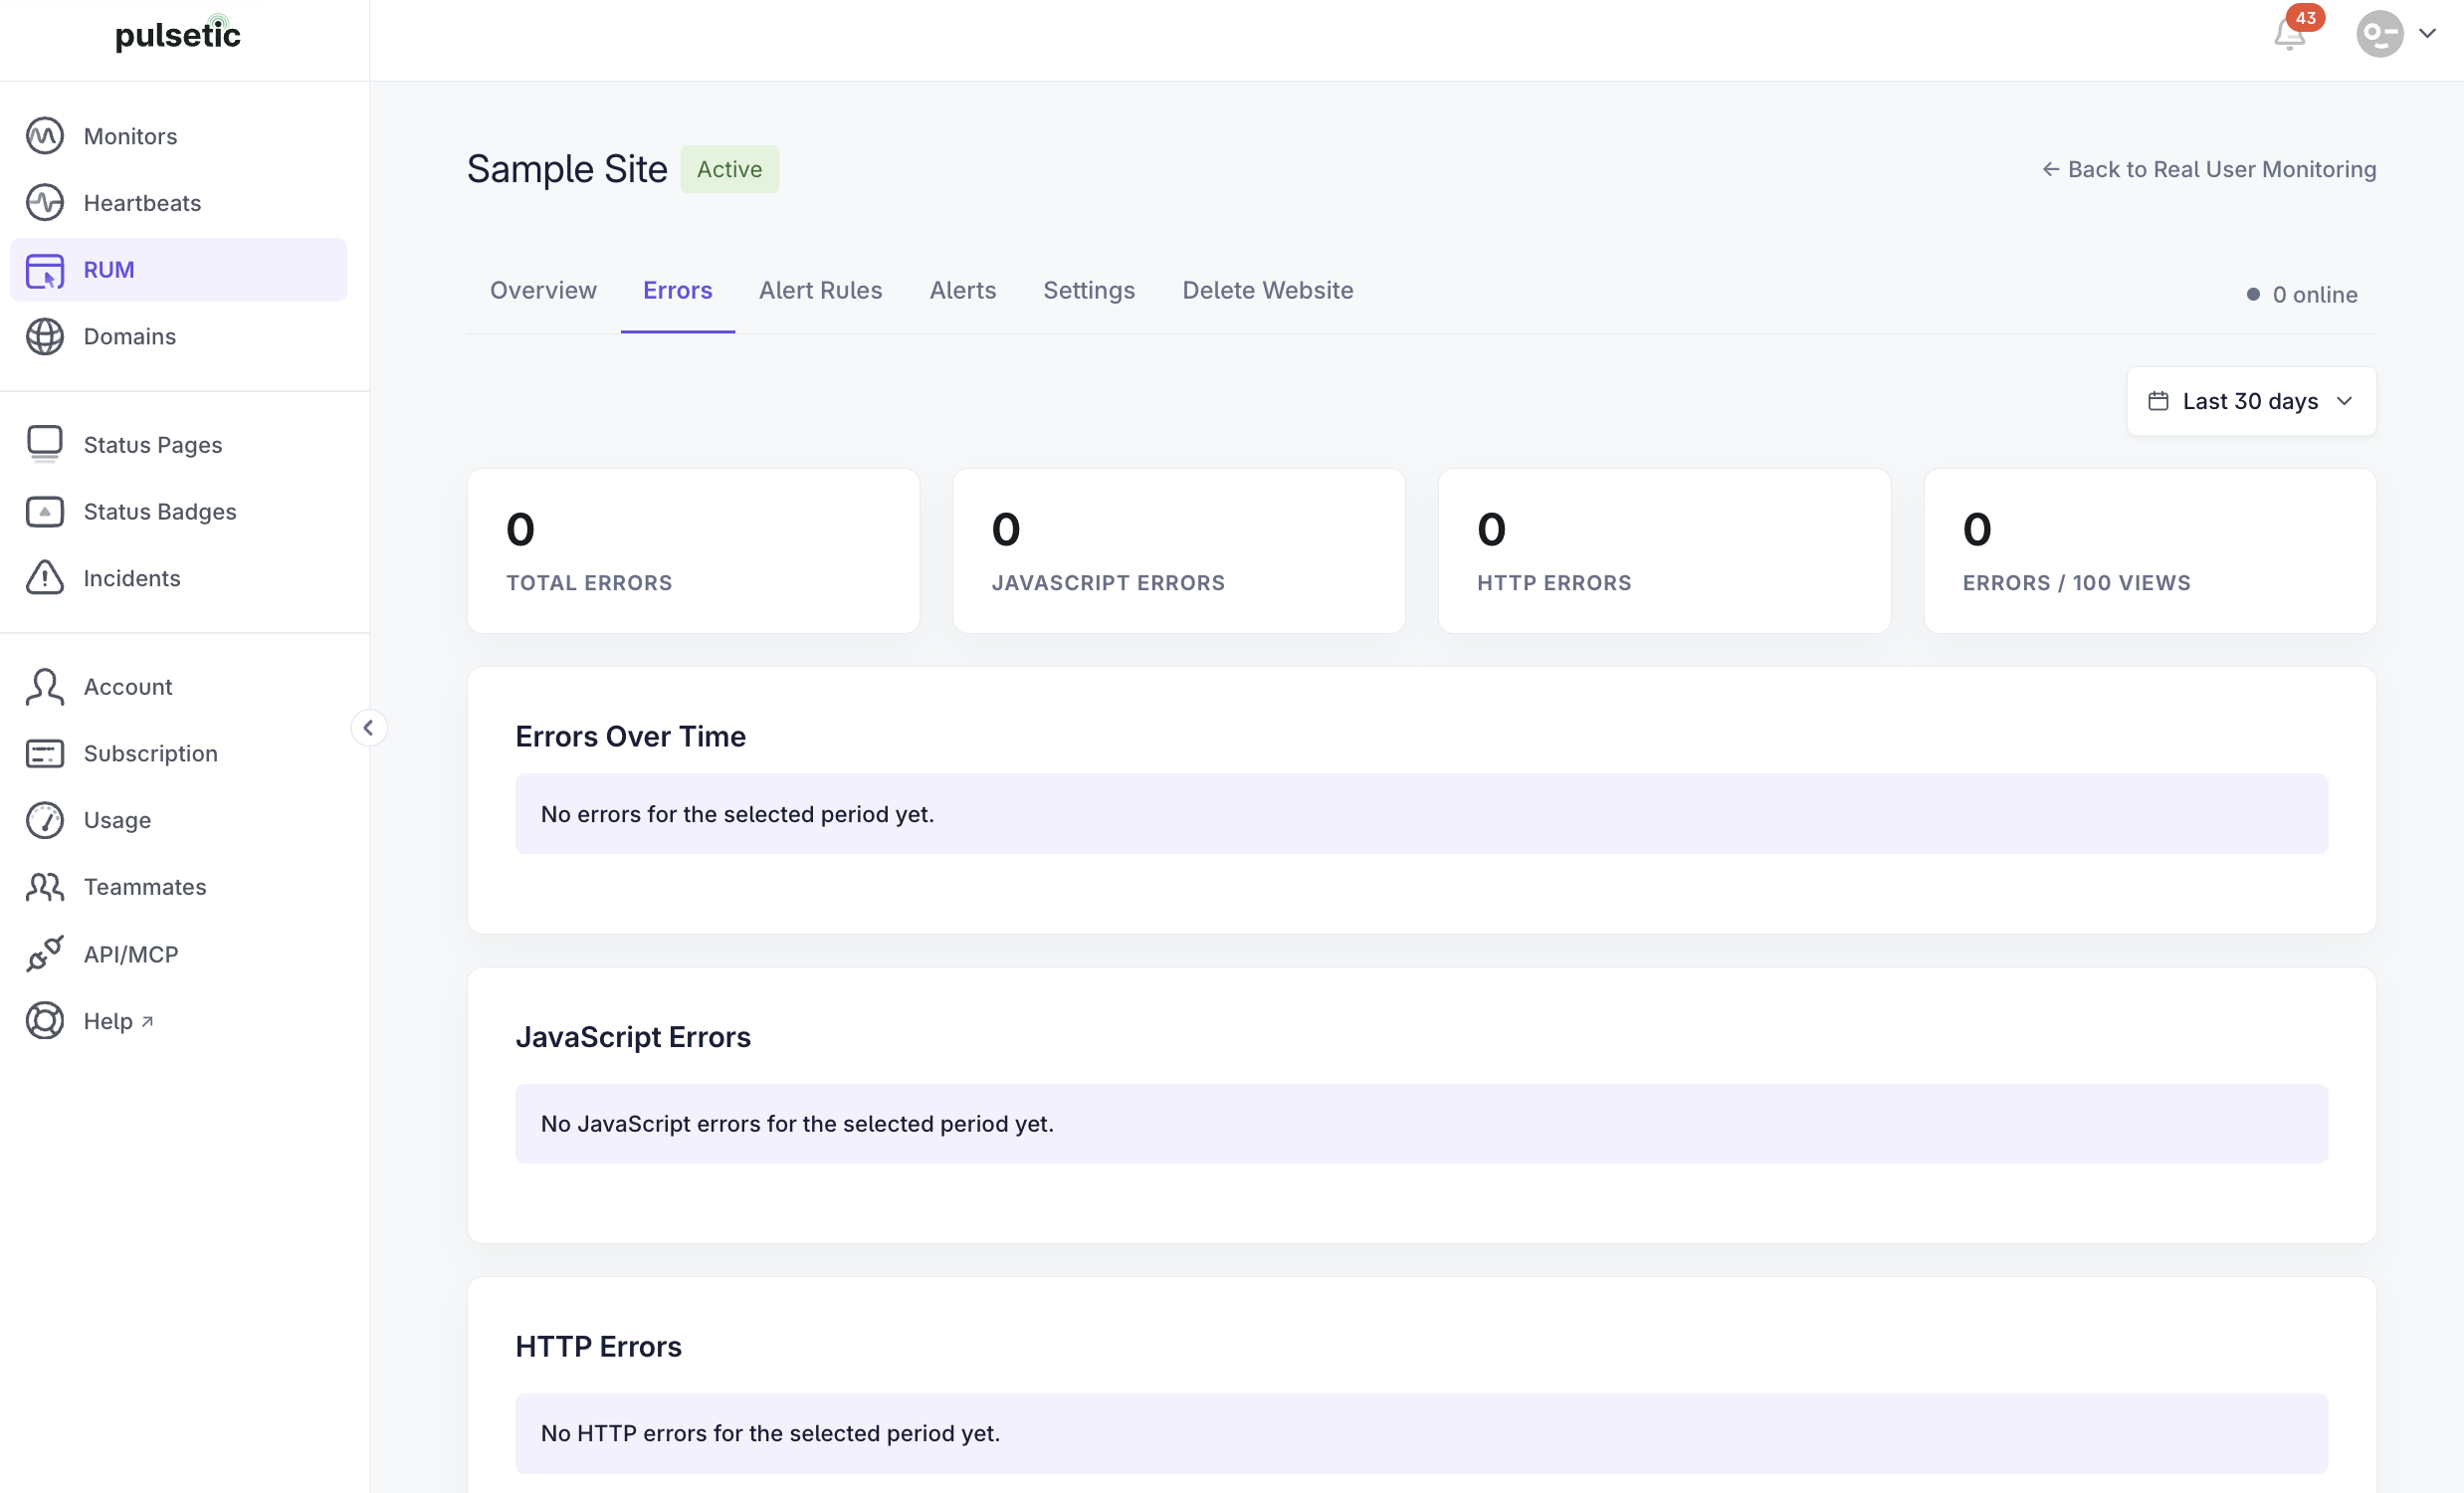
.
Step 5: Create Alert Rules
You can get alerted when real users have a bad experience by setting up specific thresholds in the Alert Rules tab. Notification channels stay silent until an alert rule triggers.
- Navigate to the Alert Rules tab. If you have no rules yet, you can click a quick-start template under "start from a common rule" (e.g., LCP p75 above 2500 ms, Error rate above 5%, or JS errors double). Alternatively, click Create Alert Rule to build one from scratch.
- Configure rule parameters:
- Name: Give your rule a clear title (e.g., "Slow LCP").
- Metric & Condition: Choose what to watch (e.g., LCP p75) and the condition (e.g., Above a fixed value).
- Threshold: Enter the specific value that triggers the rule (e.g., 2500 ms).
- Window: Select how much recent traffic each evaluation looks at (e.g., 30 minutes).
- Minimum page views: Enter a minimum traffic amount so a handful of slow visits cannot trigger a false alarm.
- Consecutive breaches: Set how many evaluations in a row must fail before we notify you. You are notified once per incident, not on every evaluation.
- Recovery factor: The alert recovers only once the metric drops below the threshold multiplied by this factor. This ensures a value hovering on the threshold line does not send constant alerts.
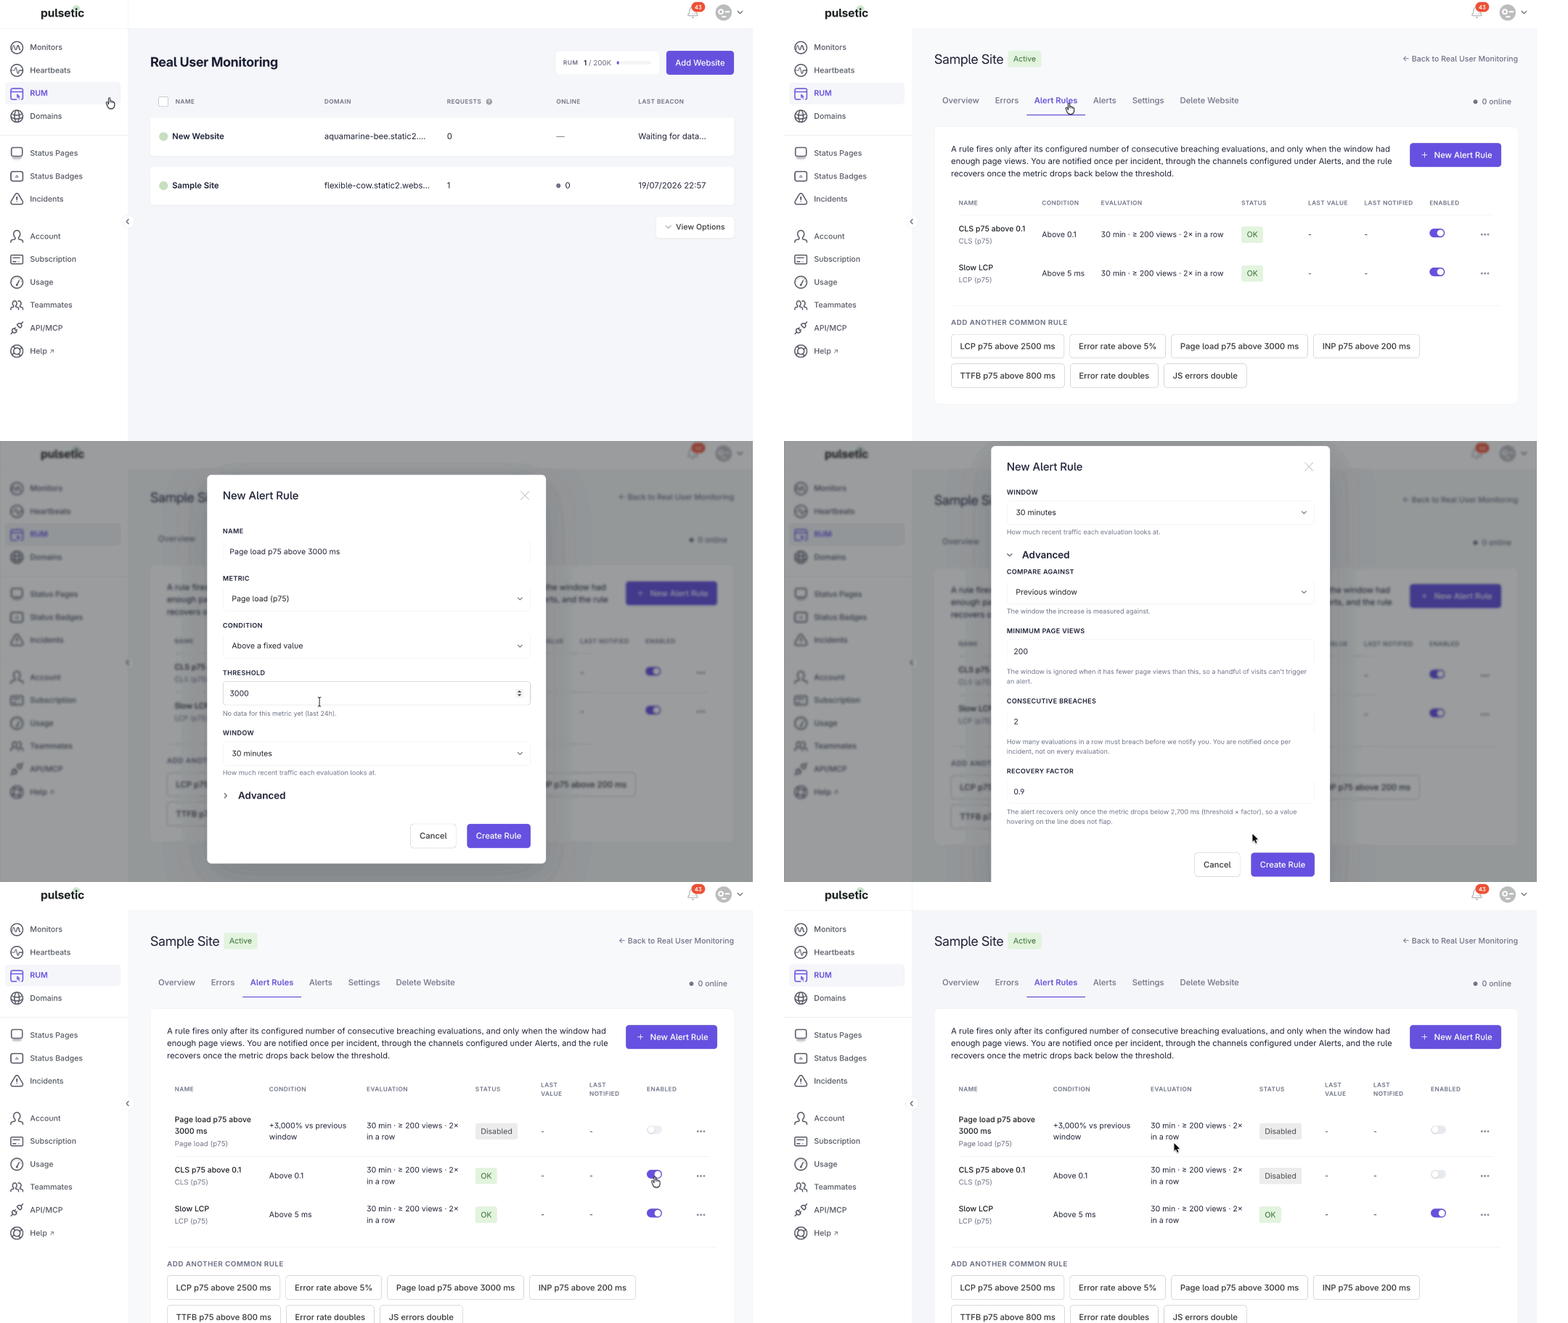
Understanding Alert Behavior
Pulsetic evaluates alert rules every five minutes and only notifies you when an issue persists across consecutive evaluations.
To reduce alert fatigue, alerts are designed to:
- Ignore insufficient traffic samples
- Require repeated failures before triggering
- Send one notification per incident
- Send a recovery notification once conditions return to normal
For a complete explanation of alert states, metric definitions, notification behavior, recovery logic, and supported notification channels, see Real User Monitoring Alerts.
Step 6: Choose Where To Get Notified
Alert rules dictate when to send a warning, but you must tell Pulsetic where to send it.
Navigate to the Alerts tab. This is where you configure your notification channels (like Email, Slack, or SMS) so your team receives the alert when a rule fires.
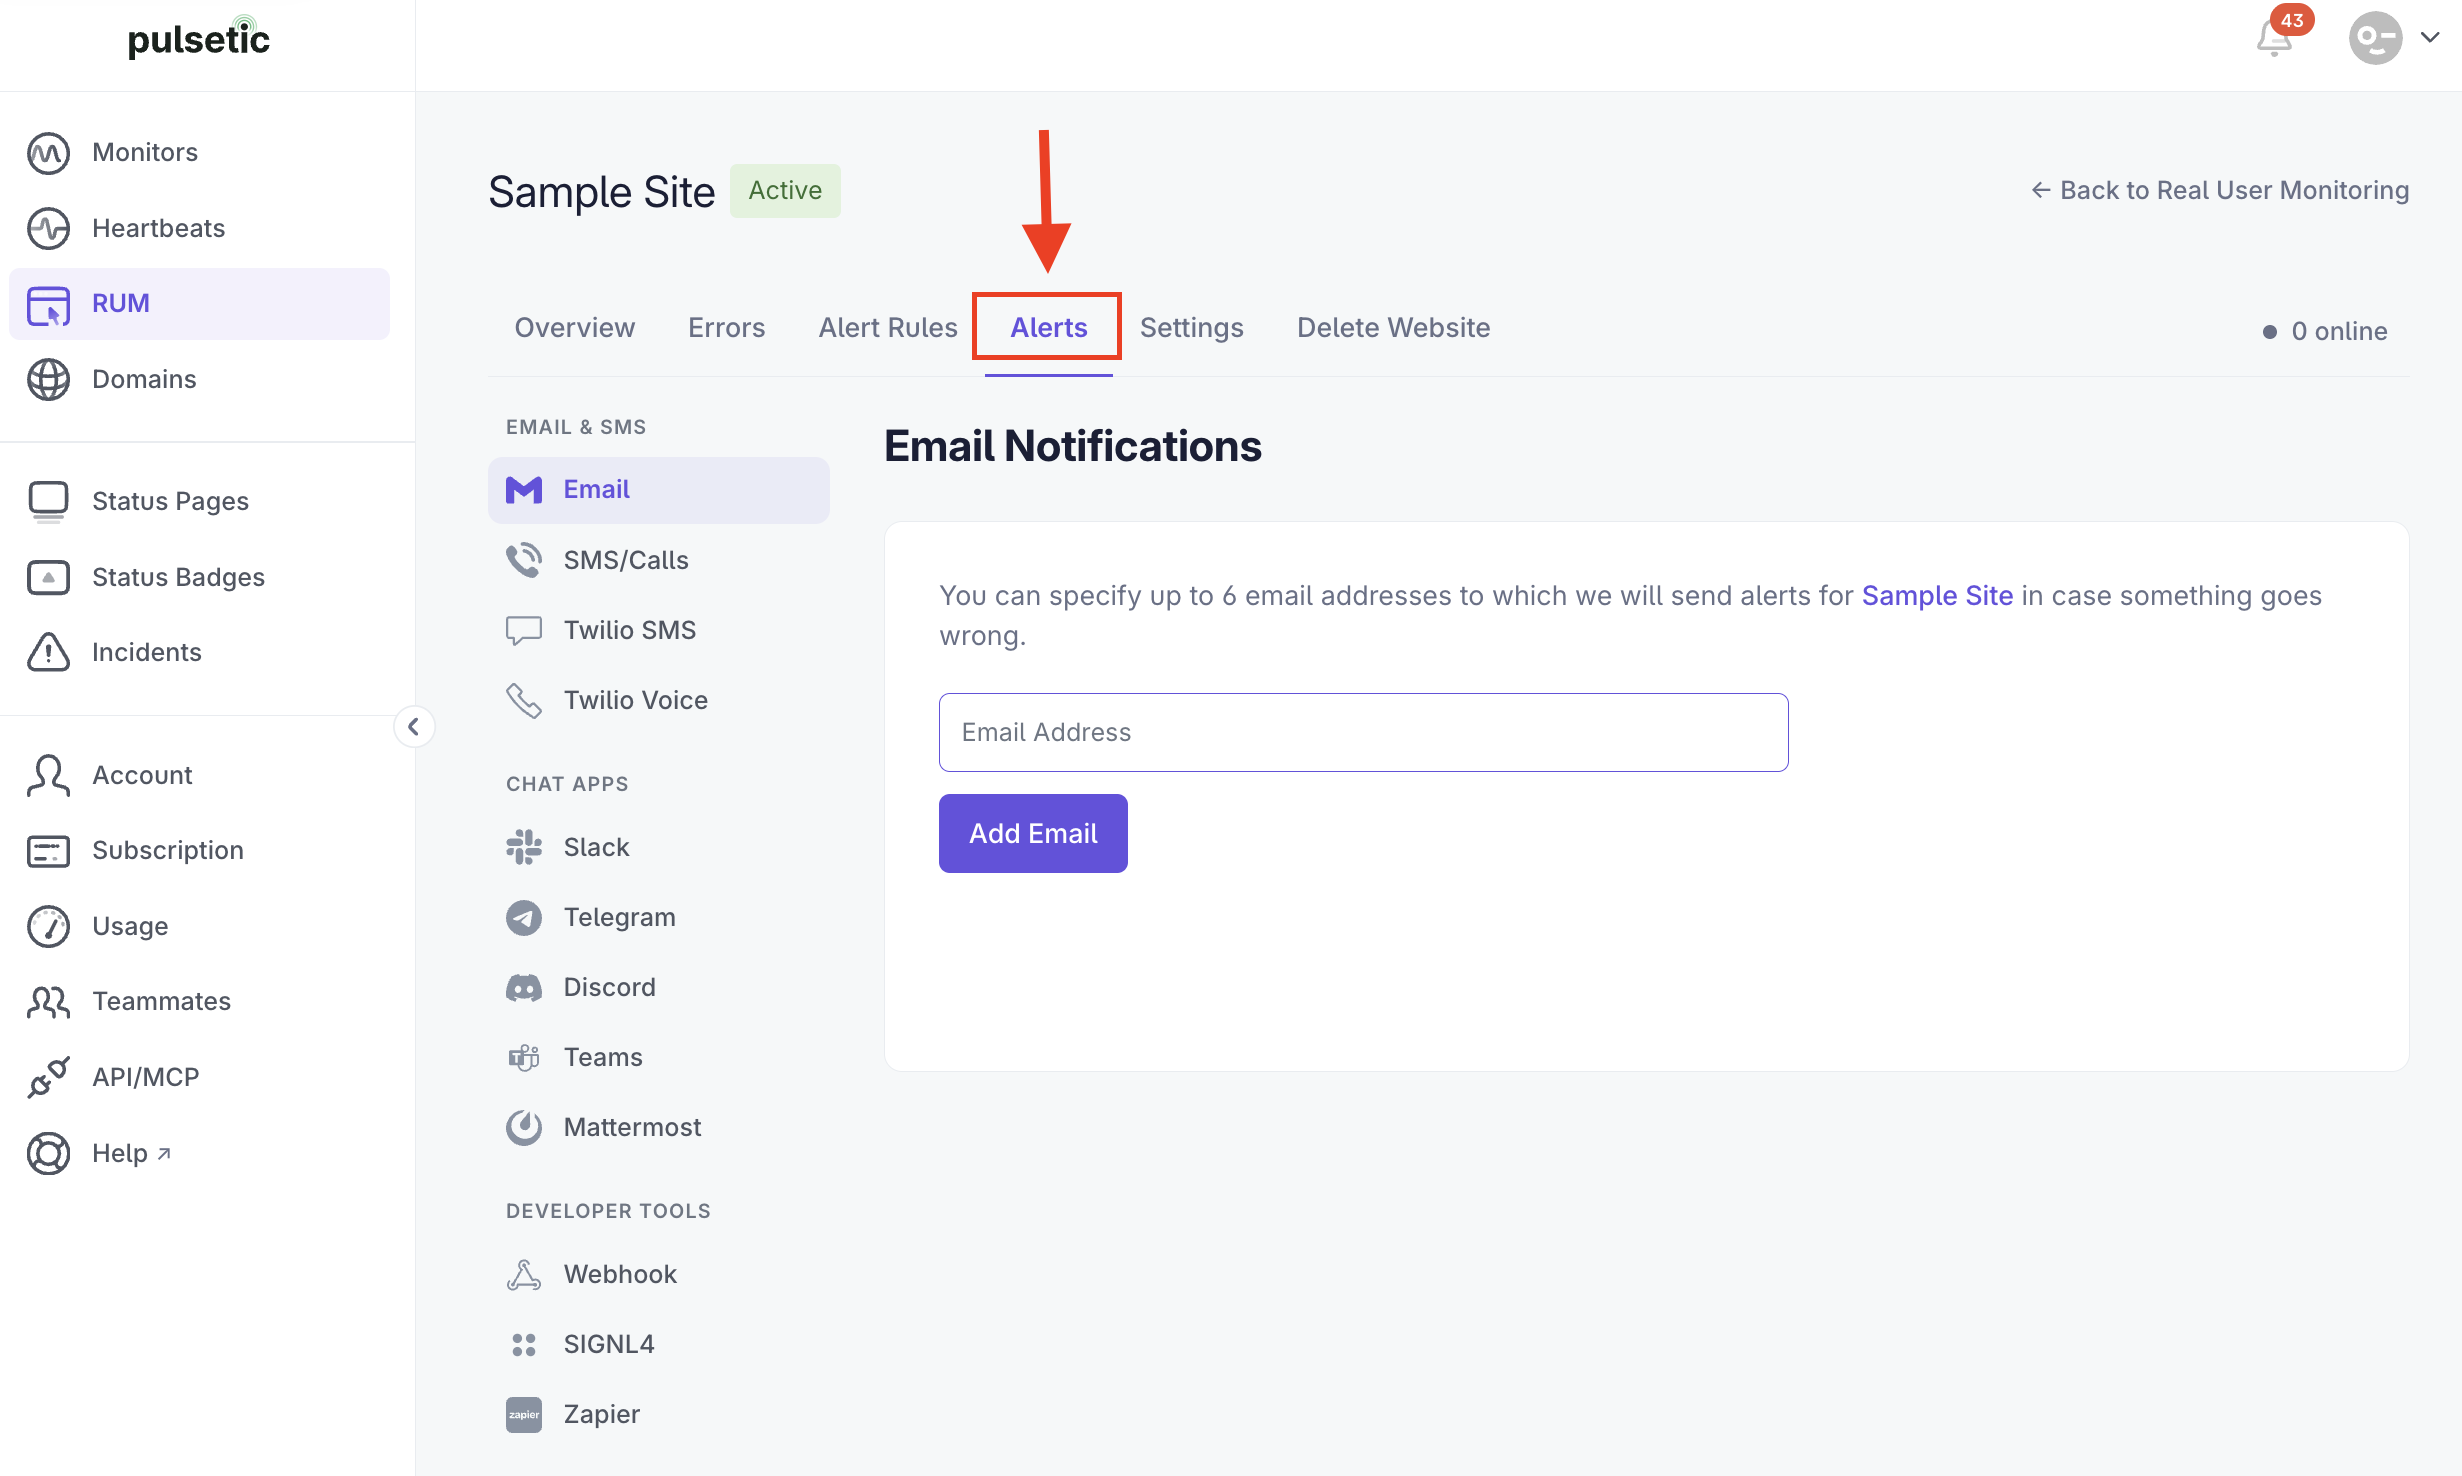
For detailed instructions on setting up these channels, see Supported Alert Notification Channels.
Step 7: Deleting a Website (Danger Zone)
This is a permanent action. Deleting a website instantly stops all tracking and permanently erases all collected analytics (pageviews, load times, Core Web Vitals, and errors).
- Review the warnings carefully.
- In the Confirm deletion field, type the word
delete. - Click the Delete website button.
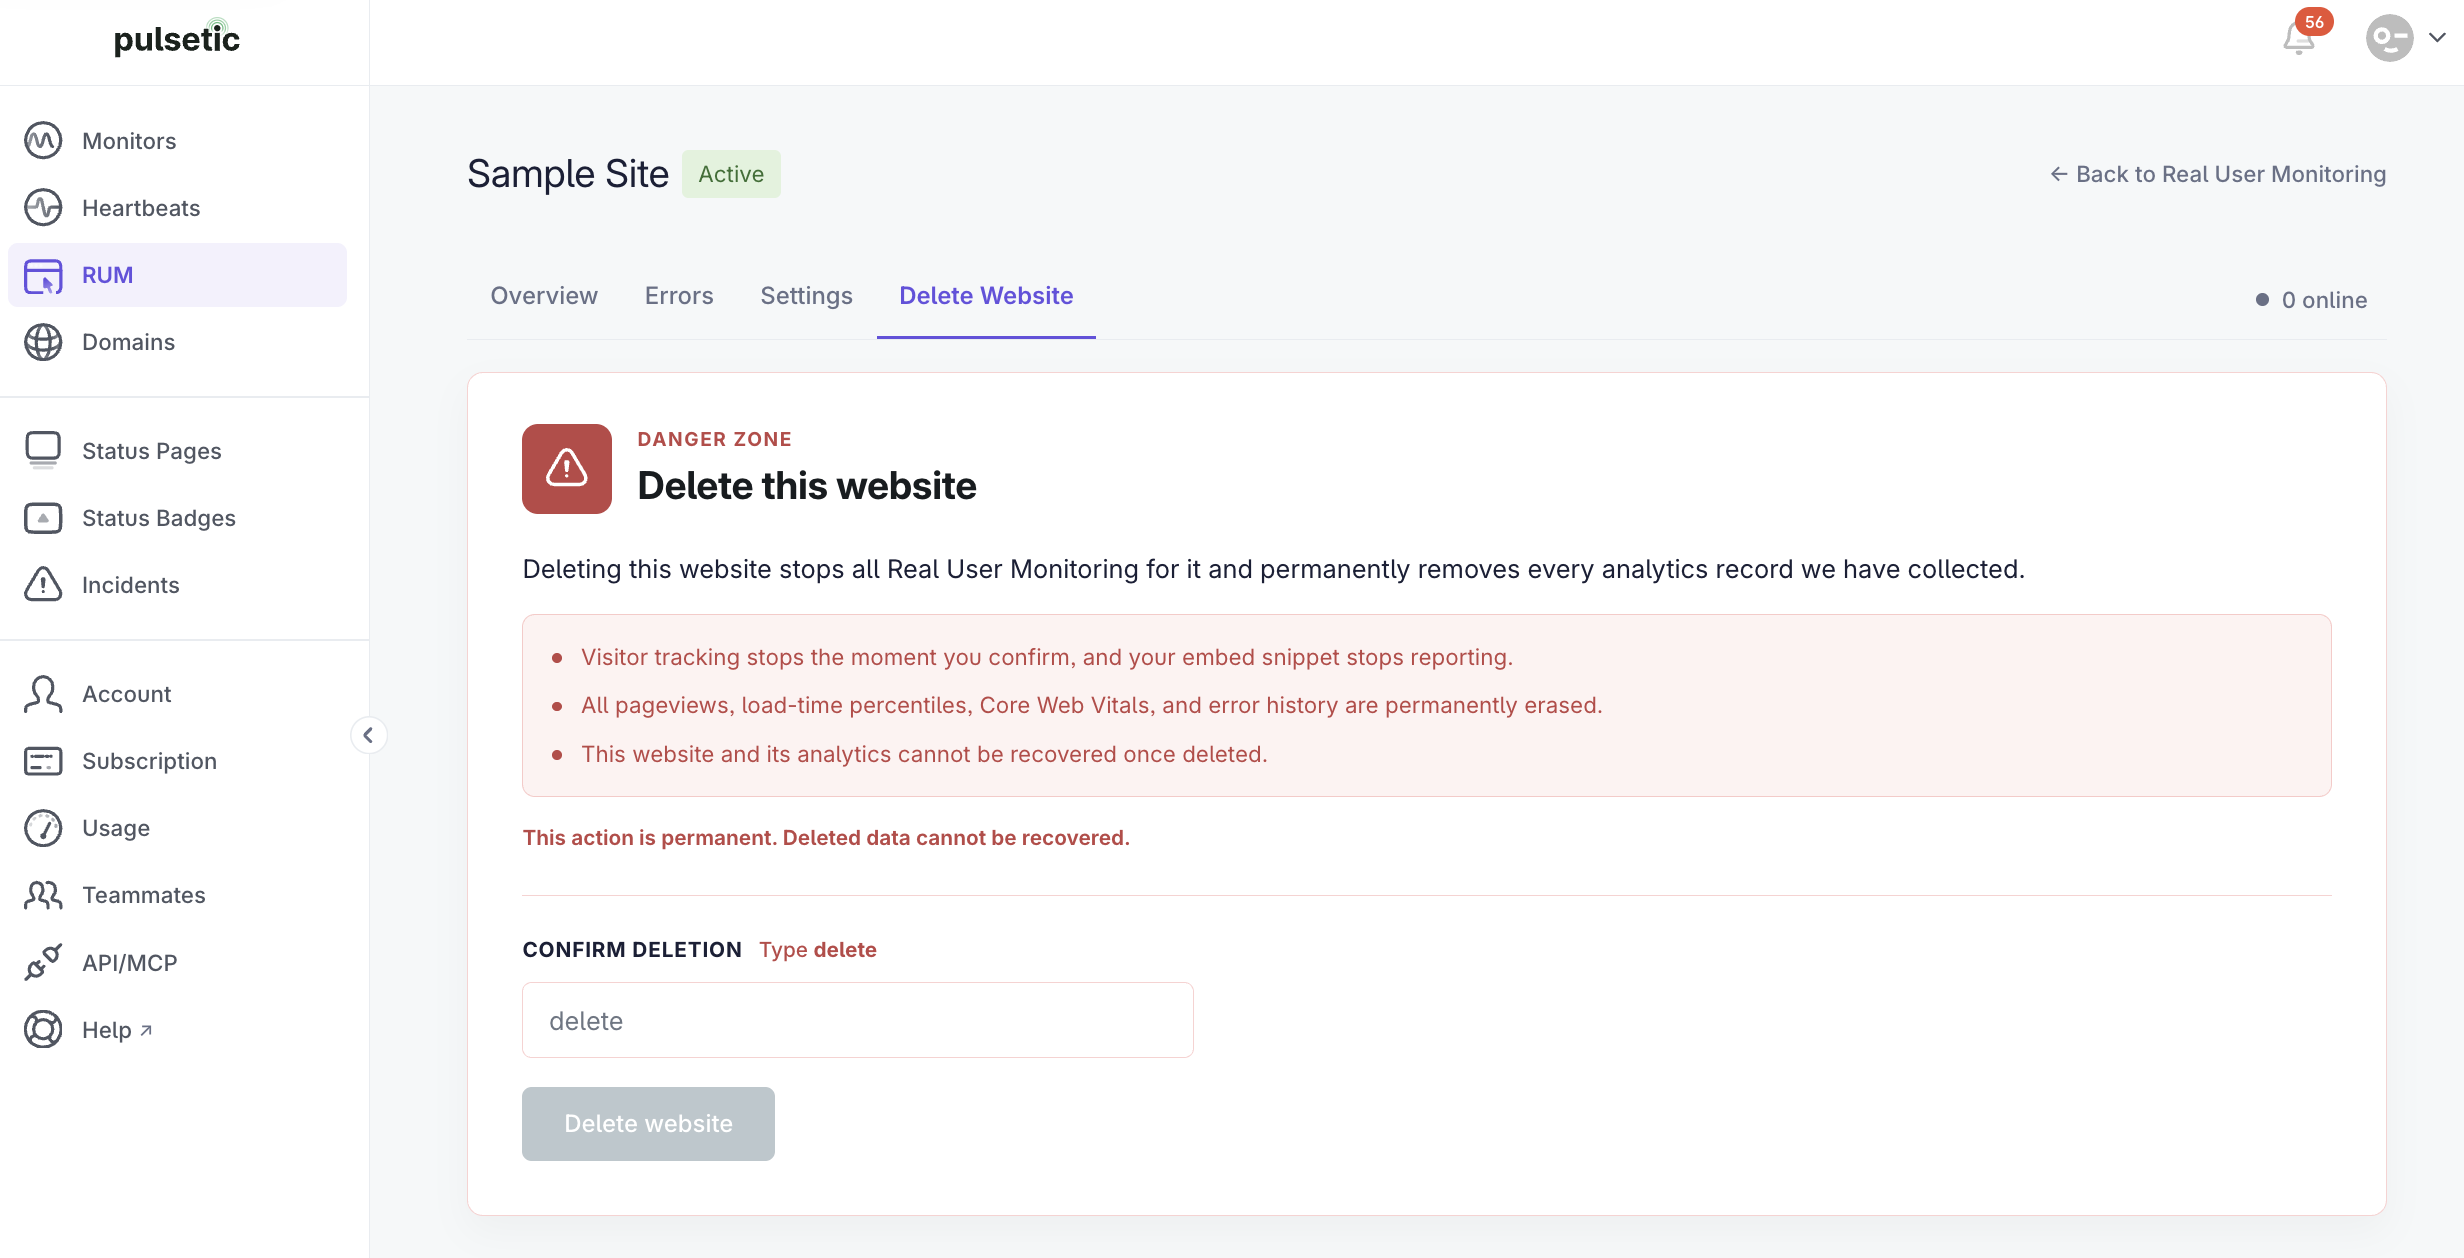
Note:
Remember to manually remove the Pulsetic tracking snippet from your website's <head> code.